This
catalog contains results from experiment
to reduce the drop scatter in a particularly noisy period (Feb.
2015) with a seismometer.
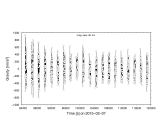
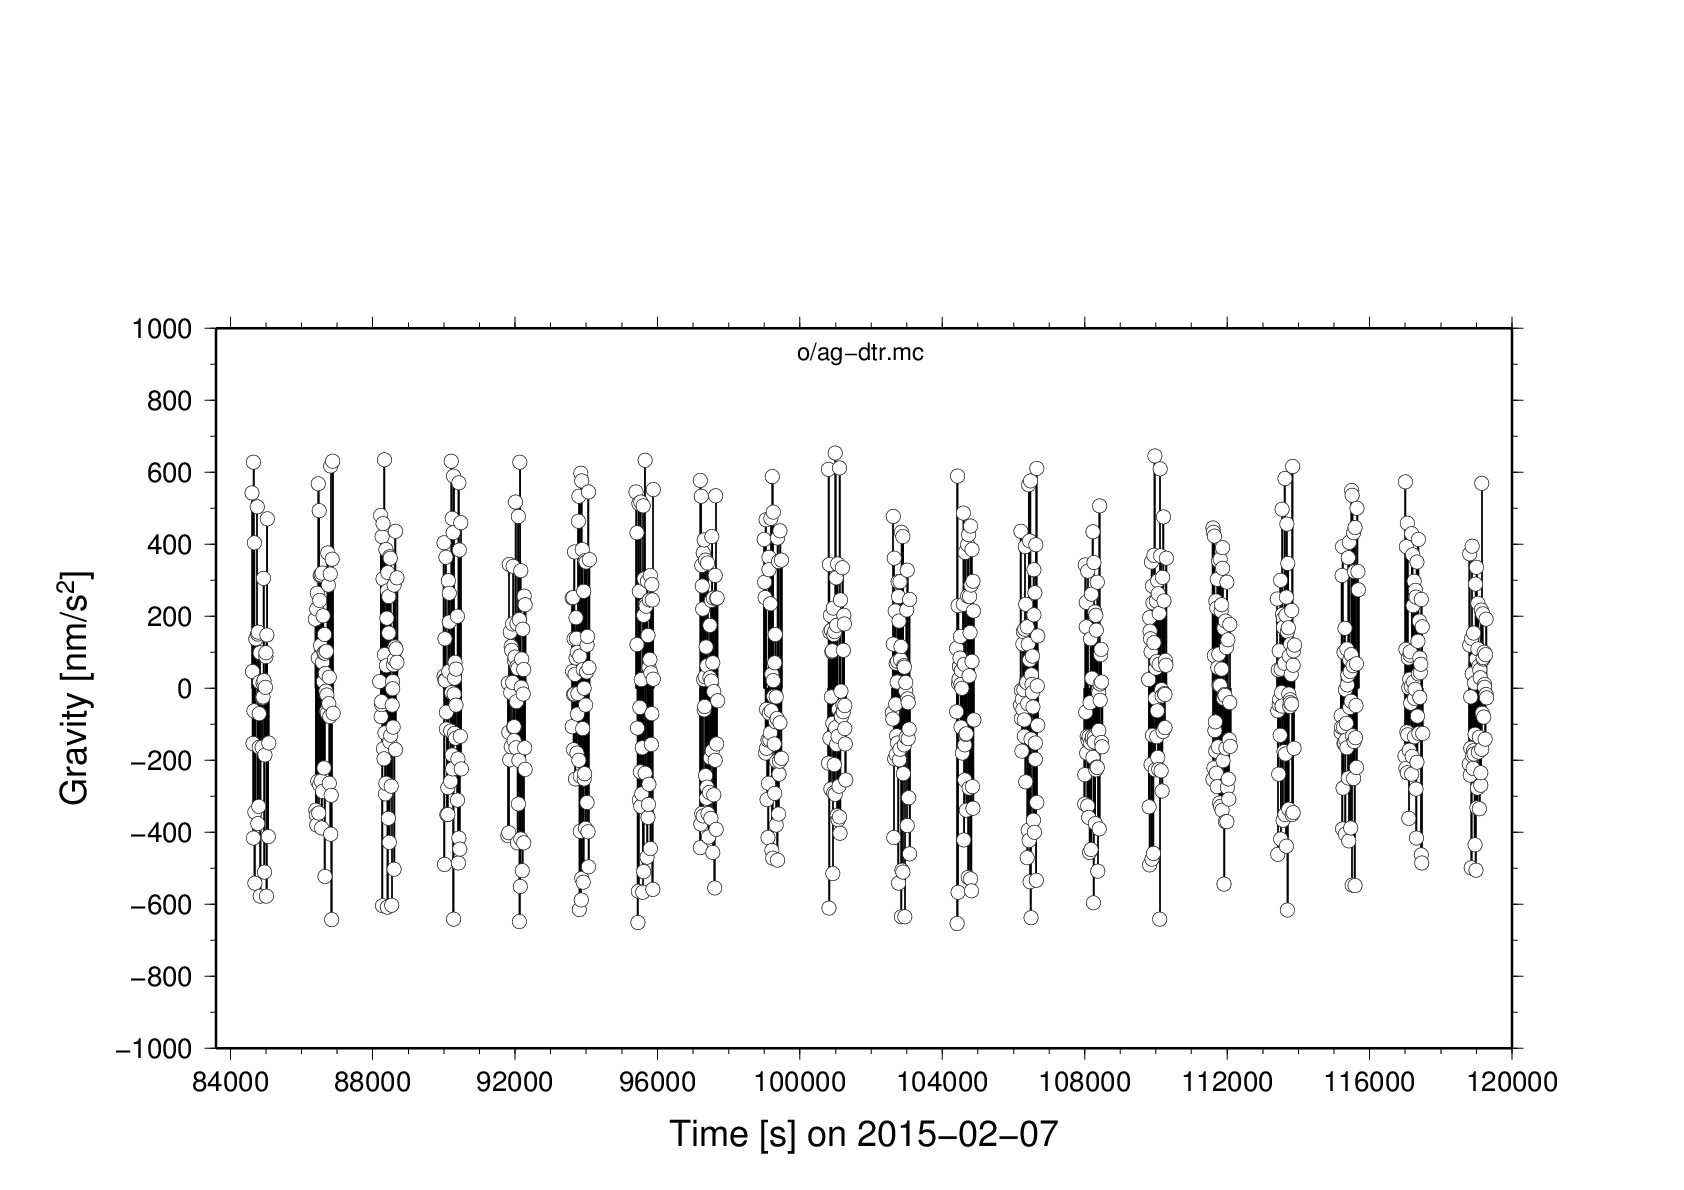
 ag-dtr.png
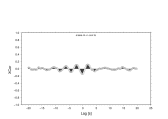
AG-drop scatter raw
 ag-seis-dtr.png
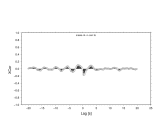
AG-drop scatter after subtracting seismometer Z acceleration at
appropriate time lag
 corr-scg-vs-time-1502.png
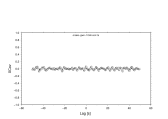
Cross-correlation between SCG (!) and seismograph Z acceleration
SCG has been sub-sampled at 10 s without any filtering, to mimick an
AG drop series (albeit with less noise).
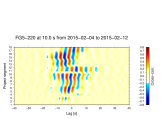 corr-vs-time-1502.png
Same as above, but now with the real FG5X-220
 scatplot-1502.png
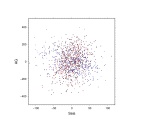
Scatter plot before and ...
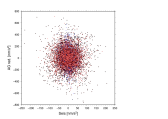 scatplot-red-1502.png
... after noise reduction with seismogram
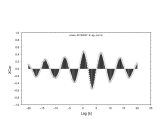
 seis-150212-Z-ag.corr.ts.png
The cross-covariance series from a batch of projects (not all in the
campaign though)
between FG5X-220 and Seismogram Z acceleration
 seis-20150207-Z-ag-corr.png
... from another batch, now including only the most noisy day
 seis-E-ag-corr.png
Cross-correlation like seis-150212-Z-ag.corr.ts.png
but now with the seismograph's east component:
No correlation! But in north...
 seis-E-n-corr.png
... there is a little. Reason perhaps: Micro-seismicity was
travelling in north-south direction
(Have to find out from what time window that example has been
derived). There is more and stronger evidence below:
 seis-E-z-corr.png
Seismogram-to-seismogram corroelation: E versus Z.
 seis-N-ag-corr.png
 seis-N-z-corr.png
 seis-Z-ag-corr.png
 seis-ag-10Hz.corr.png
This one is done with Seismogram at 10 smp/s. (The others at 1
smp/s)
 seis-ag-150207-scatp.png
The noisiest day and ...
 seis-ag-150212-scatp.png
... the quietest day. Here now very little systematics
 seis-ag-res-150207-scatp.png
After noise reduction. To be compared to seis-ag-150207-scatp.png
 seis-ag-res-150212-scatp.png
After noise reduction. To be compared to seis-ag-150212-scatp.png
 seis-ag.corr.png
(don't remember now, sorry. Perfer seis-Z-ag-corr.png)
 seis-gwn-10Hz.corr.png
That is a test with Gaussian white noise instead of a gravimeter
 seis-scg-10Hz.corr.png
That's cross-correlation with the SCG.
 seis-ag-false.corr.png
Thats a test with AG data and Seismograph from two totally different
periods. Expect no correlation, found no correlation. Hints at a
therhold value for detection/dismissal
 seis-scg.png
That's untampered scatter plot, SCG and seismogram after
determination of the SCG anti-aliasng filter's lag. Correlation
coefficient is 0.99 (!)
 seisunfilt-scg.png
 ag-dtr.png
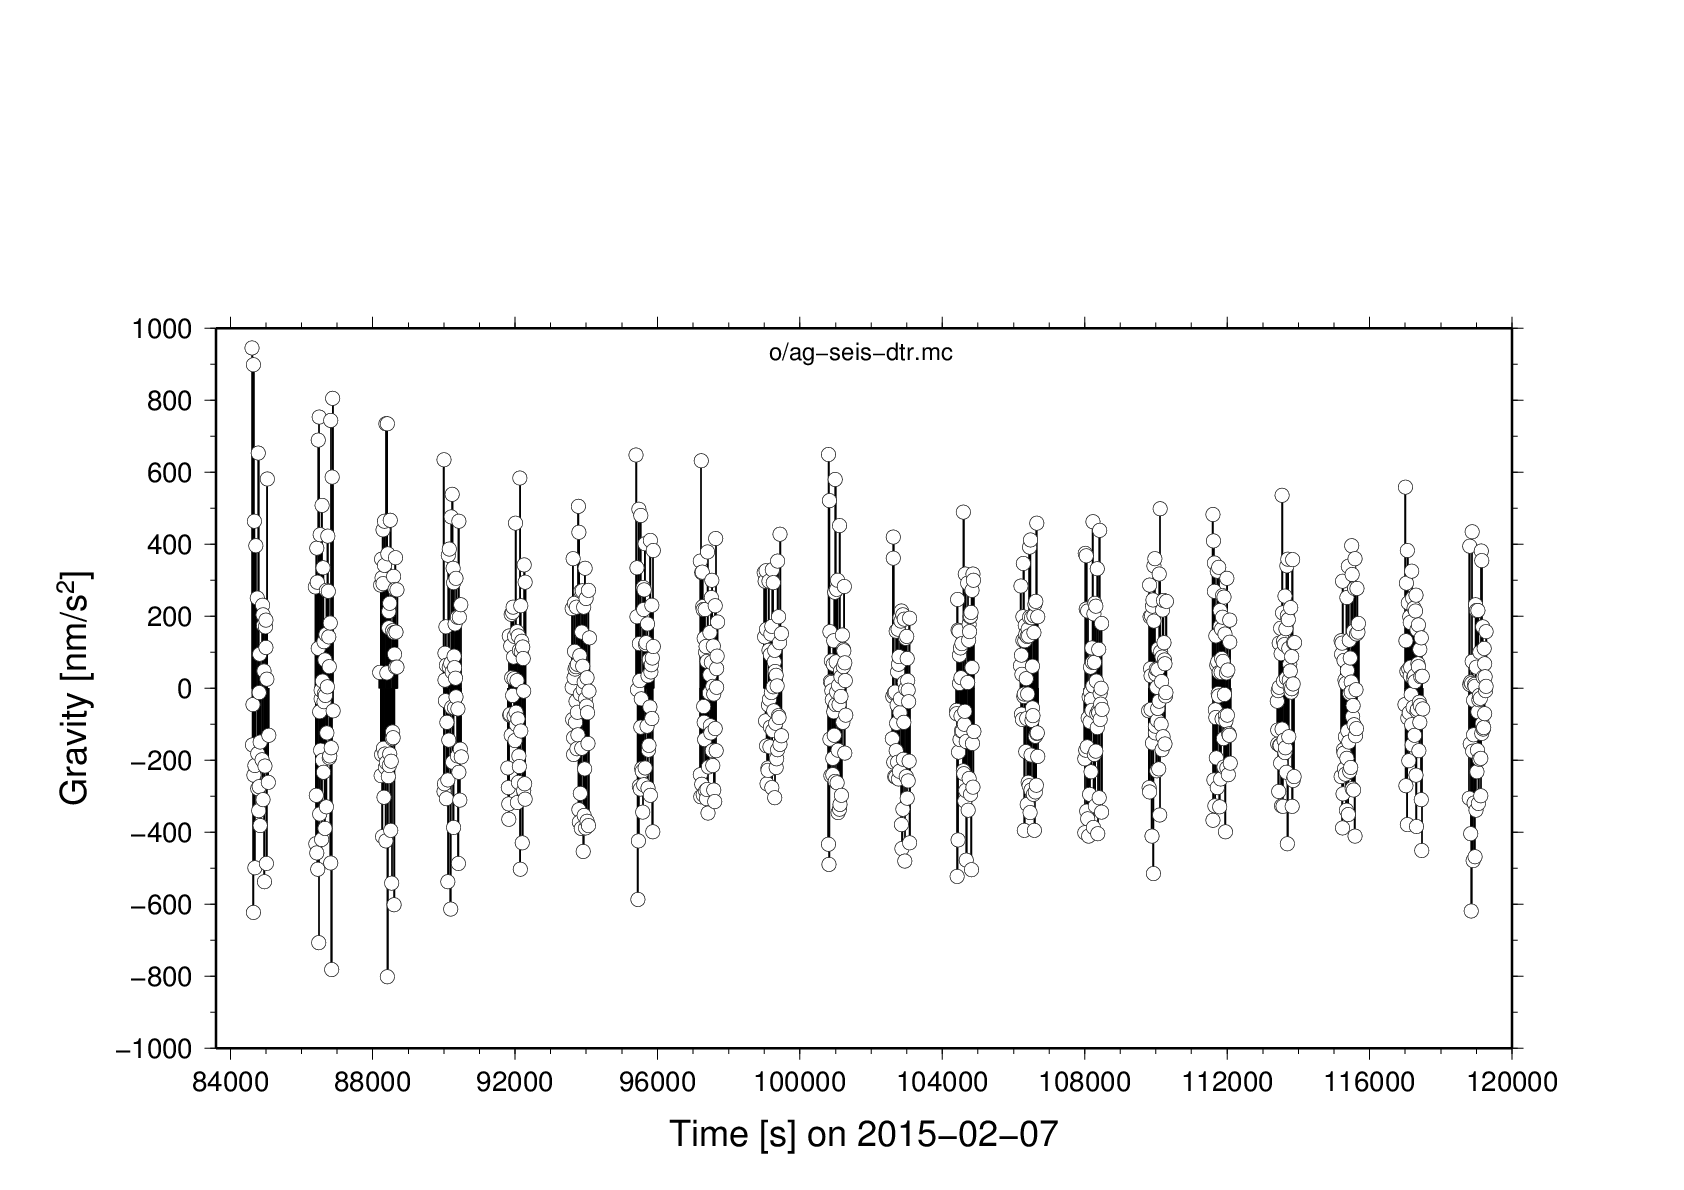 ag-seis-dtr.png
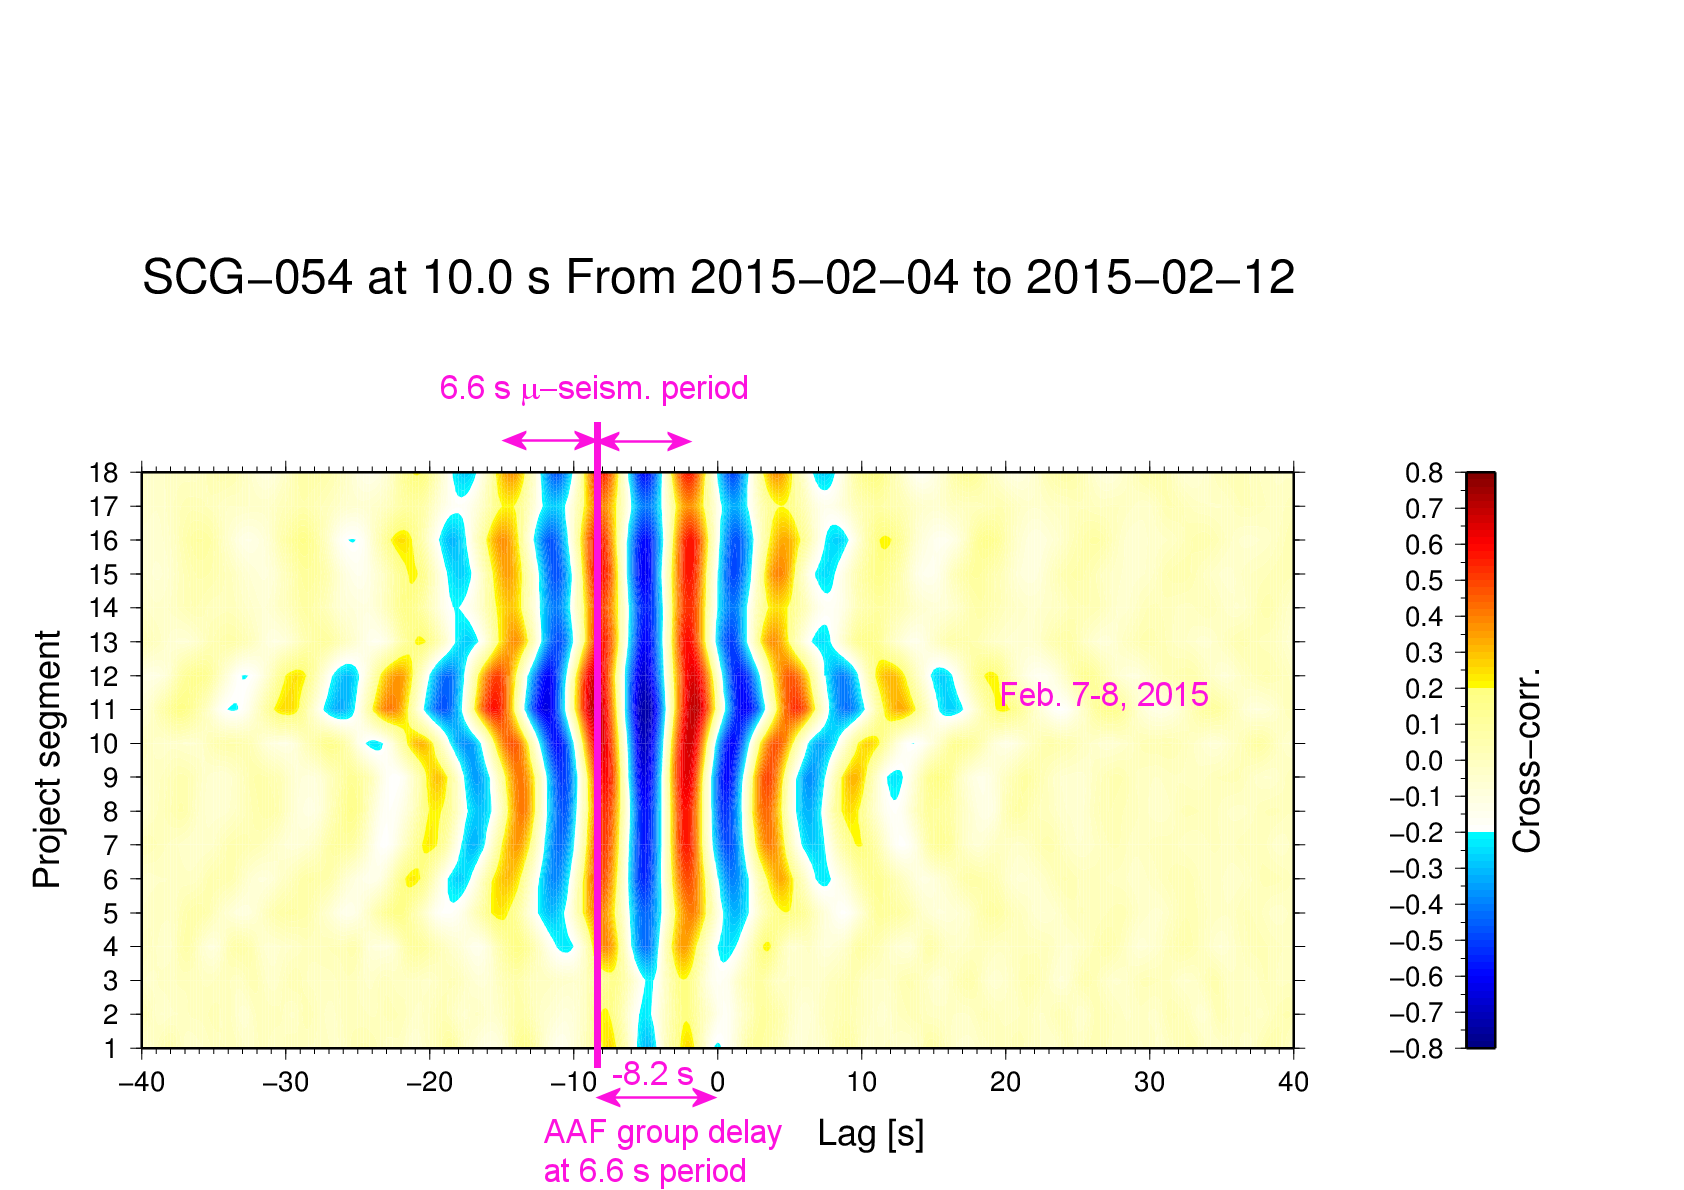 corr-scg-vs-time-1502.png
 corr-vs-time-1502.png
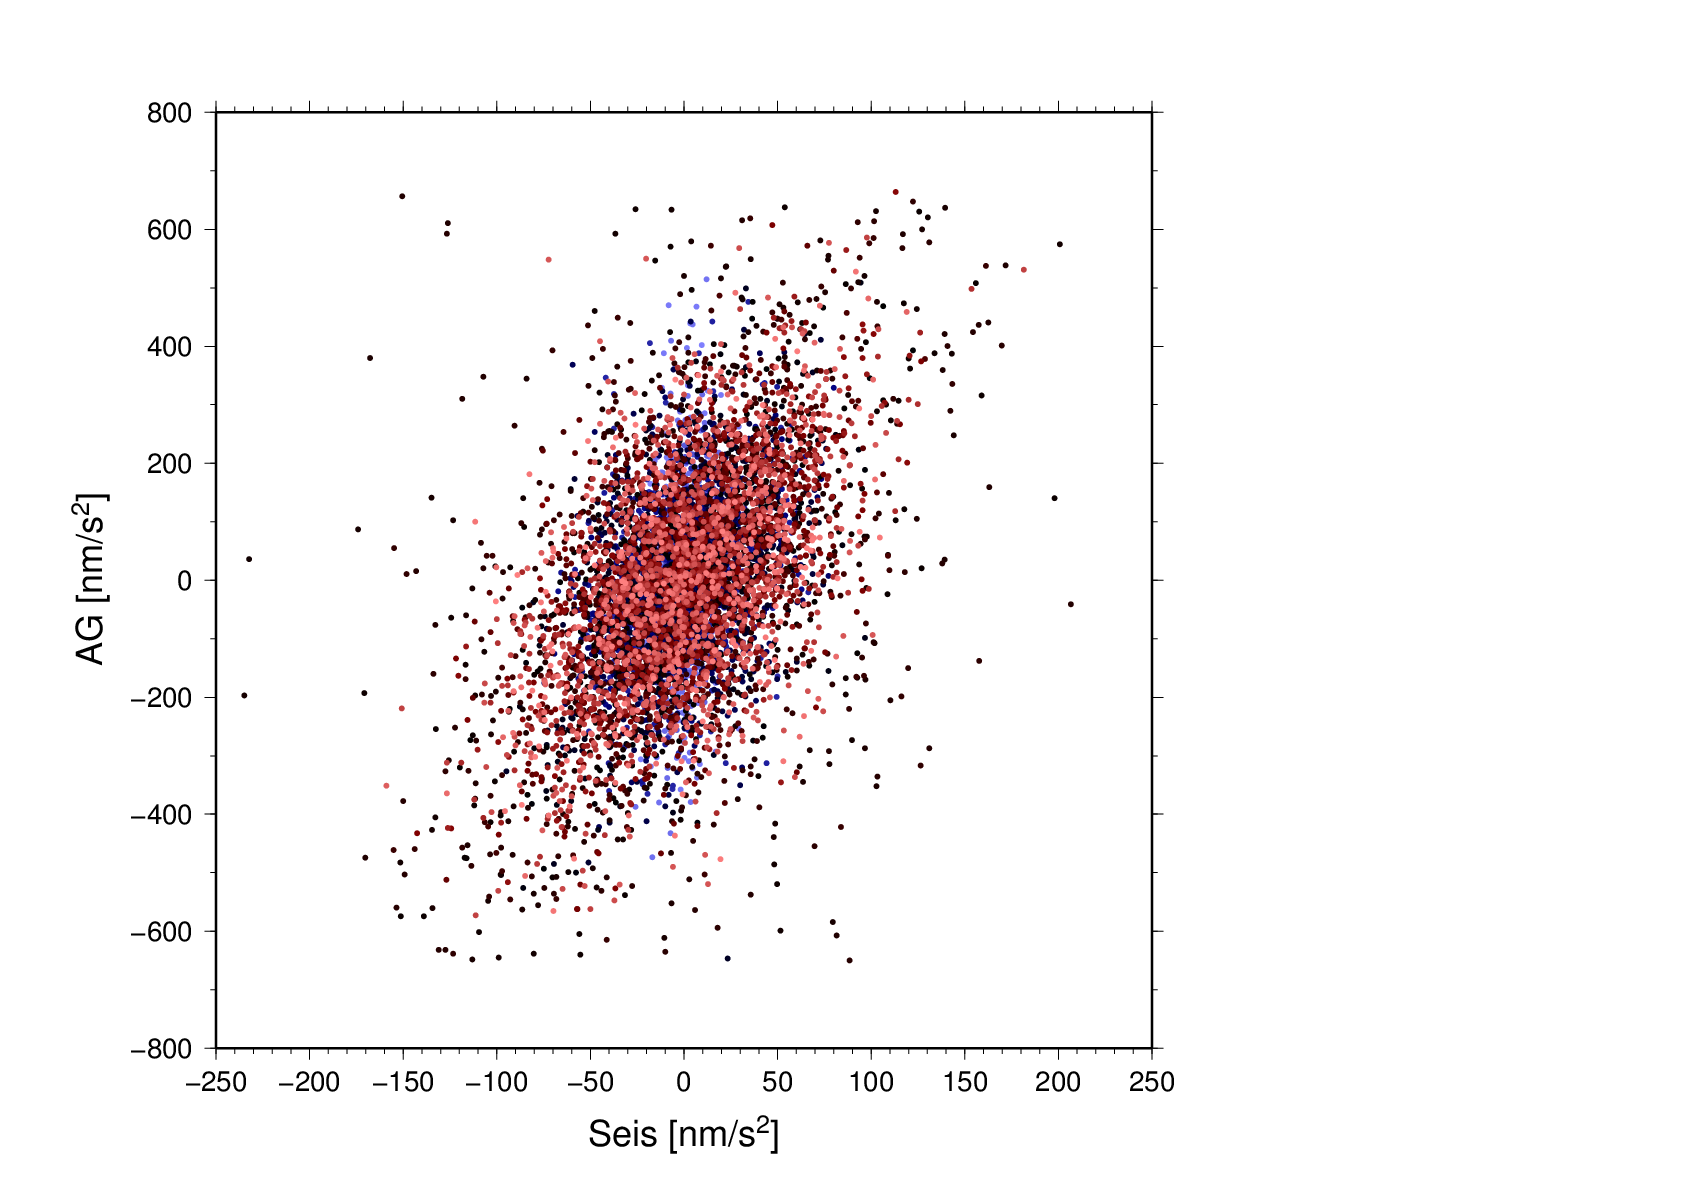 scatplot-1502.png
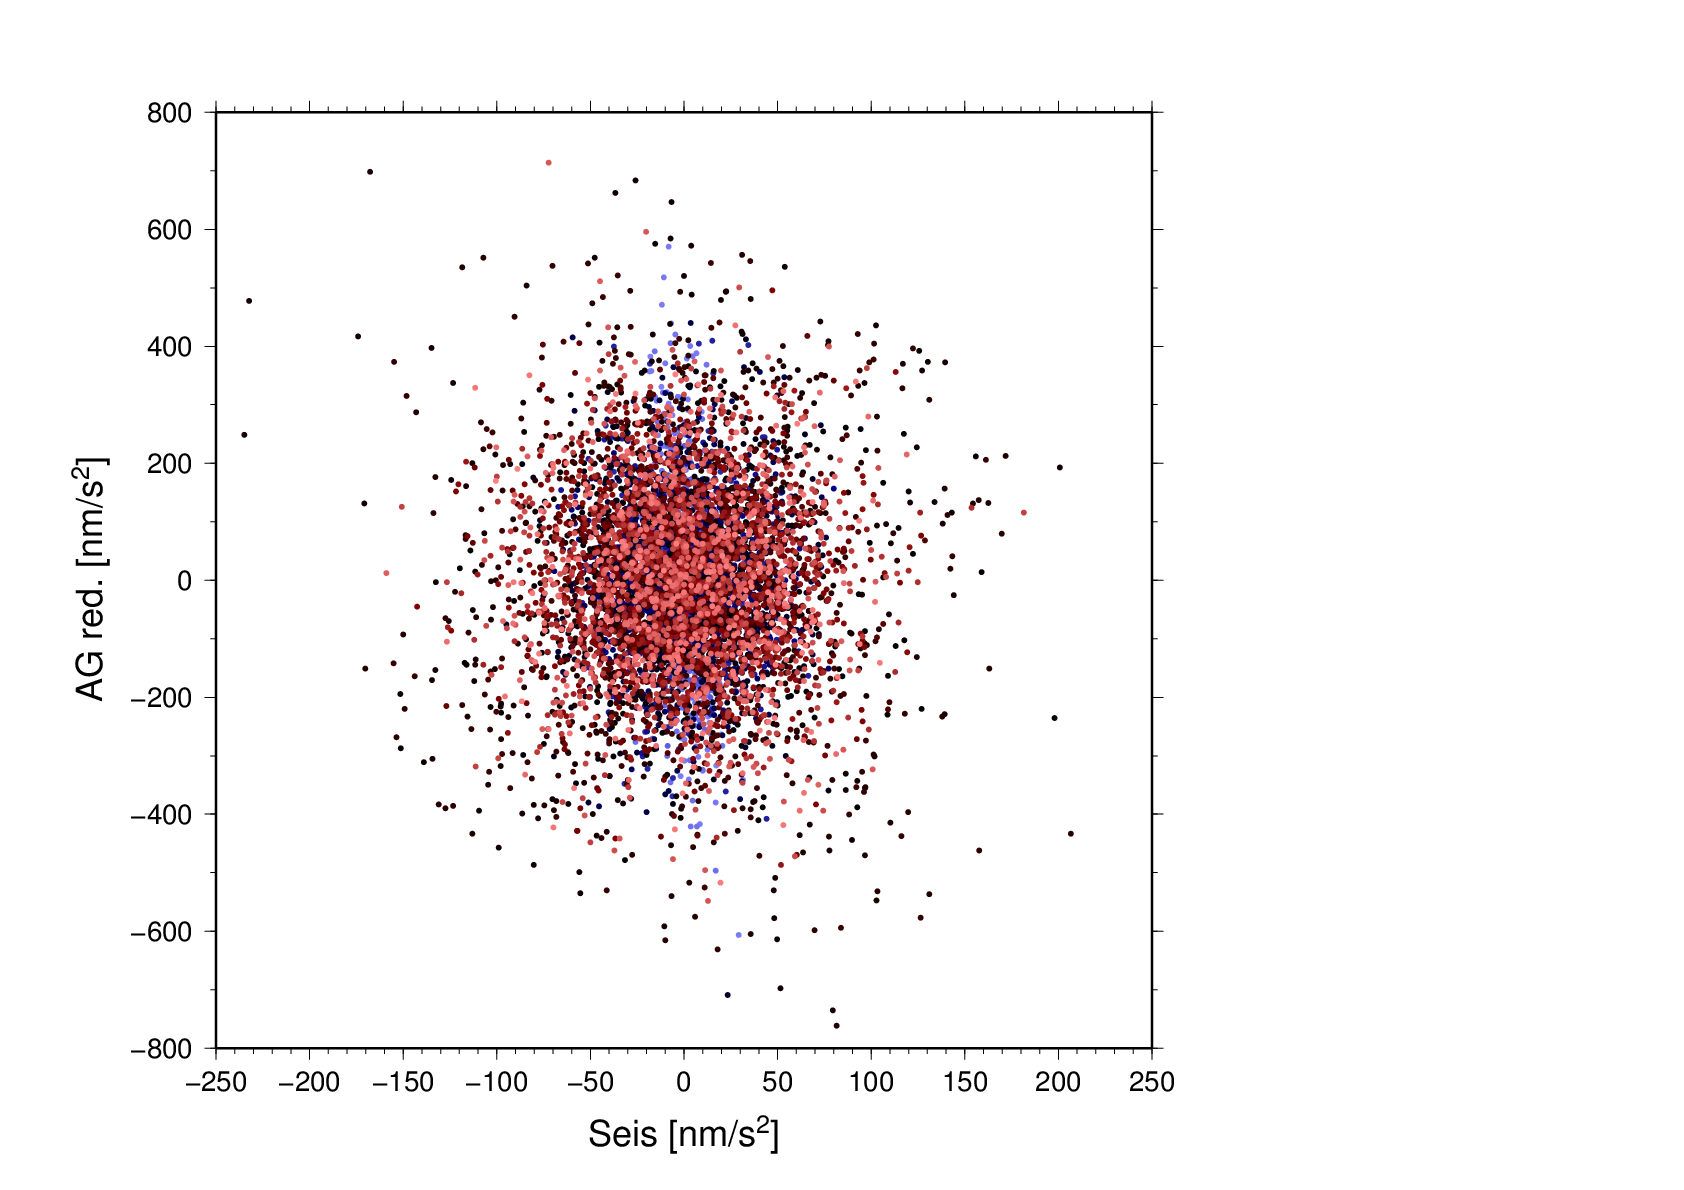 scatplot-red-1502.png
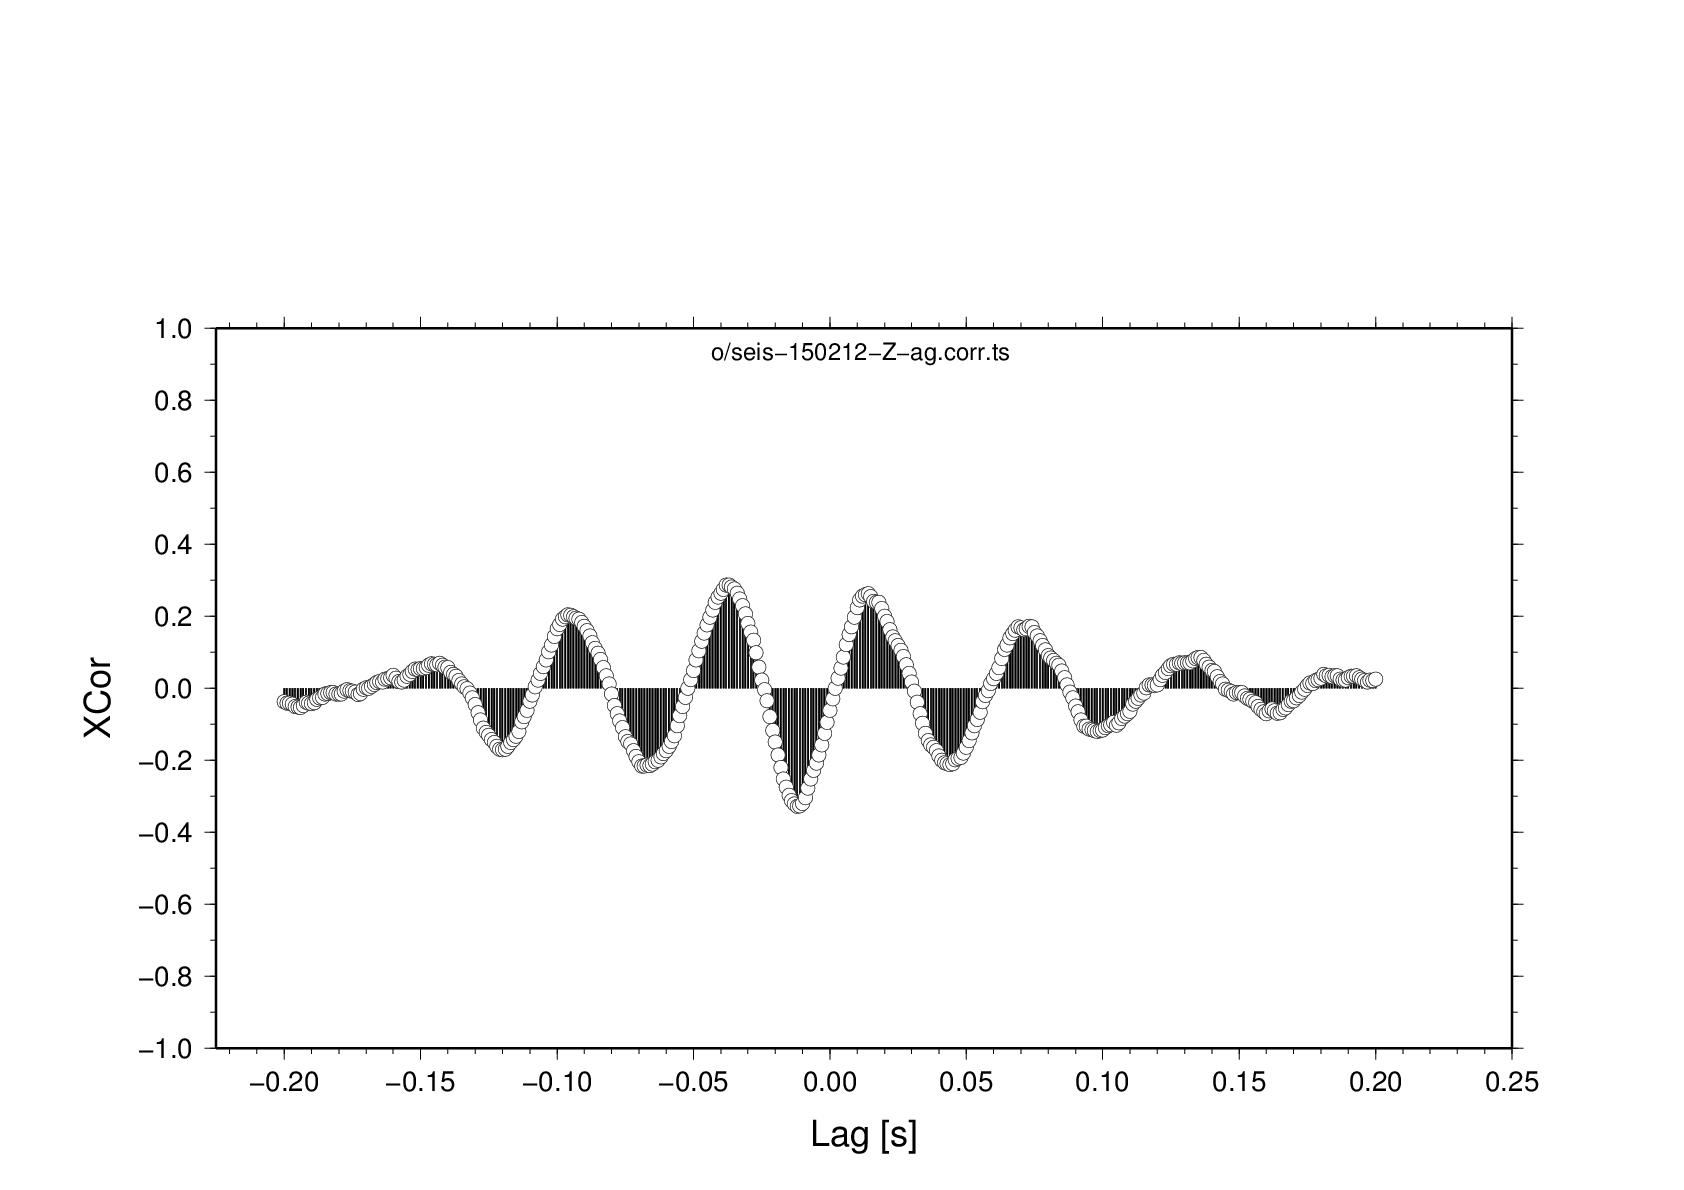 seis-150212-Z-ag.corr.ts.png
 seis-20150207-Z-ag-corr.png
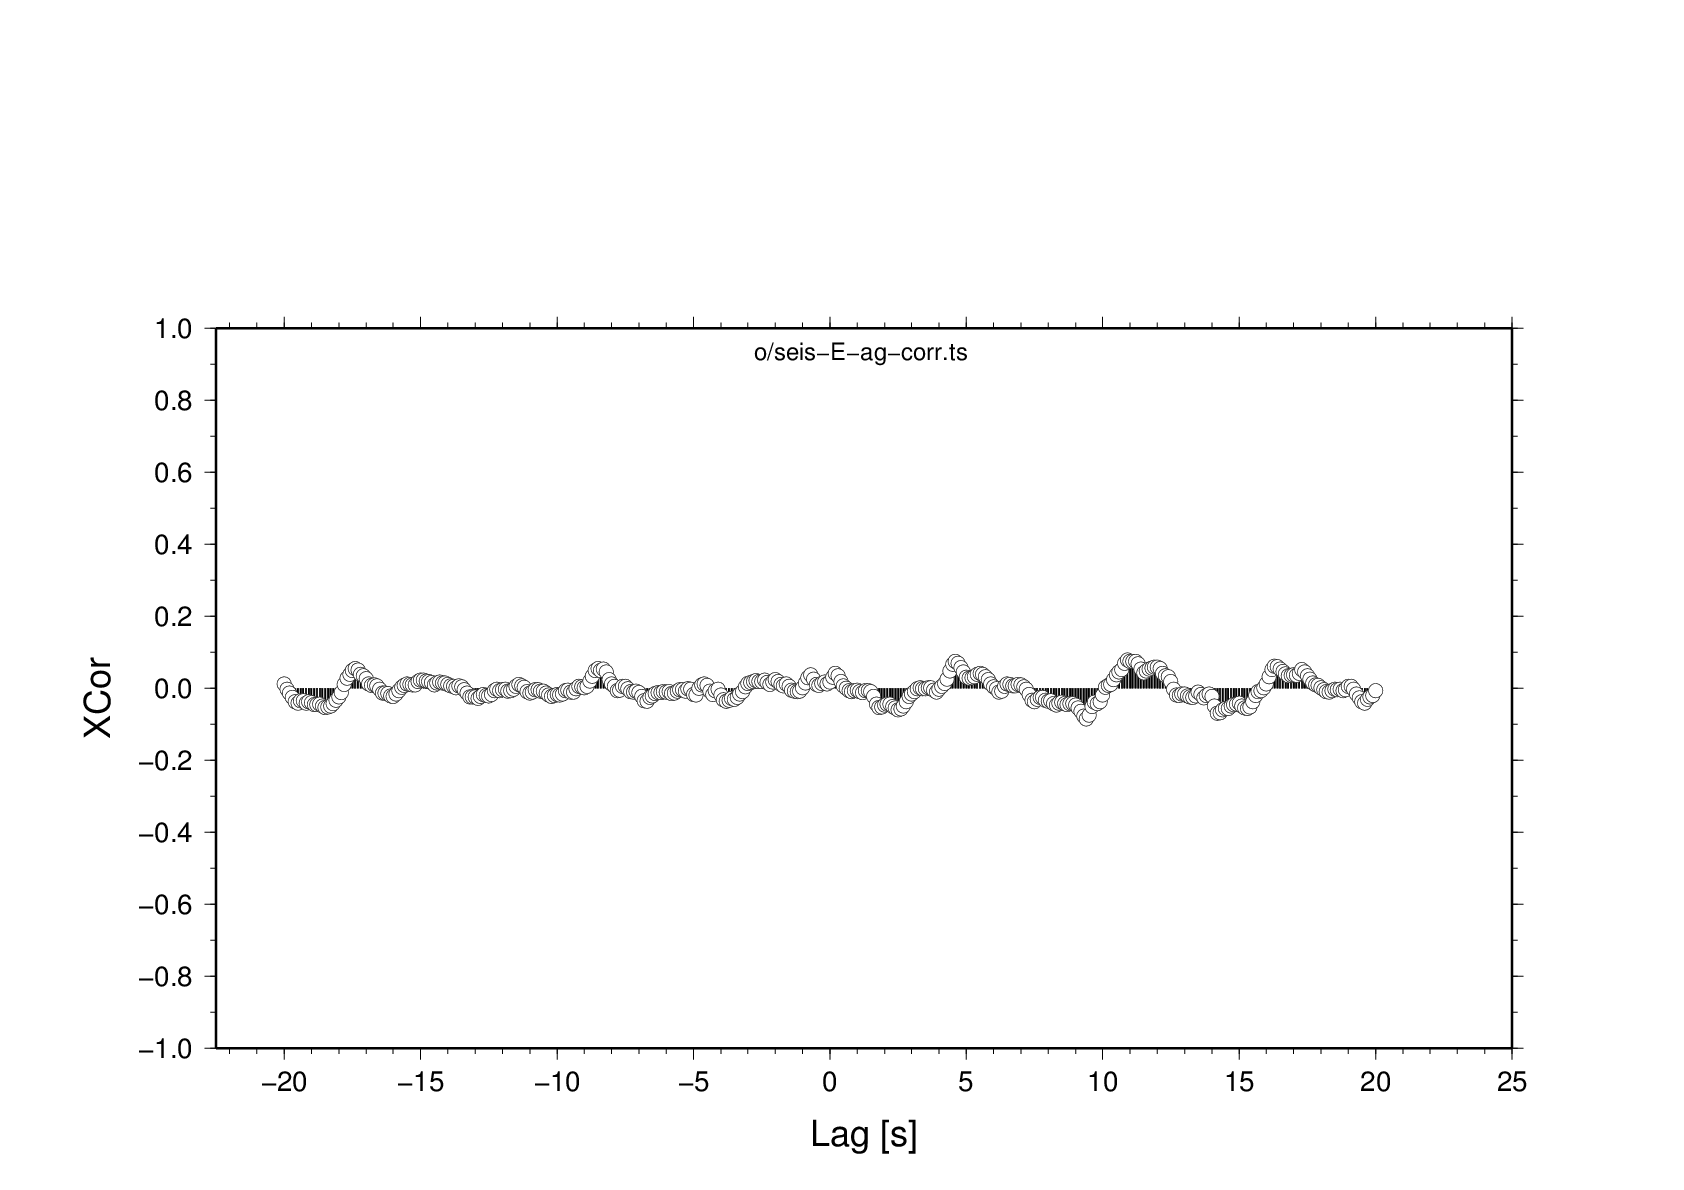 seis-E-ag-corr.png
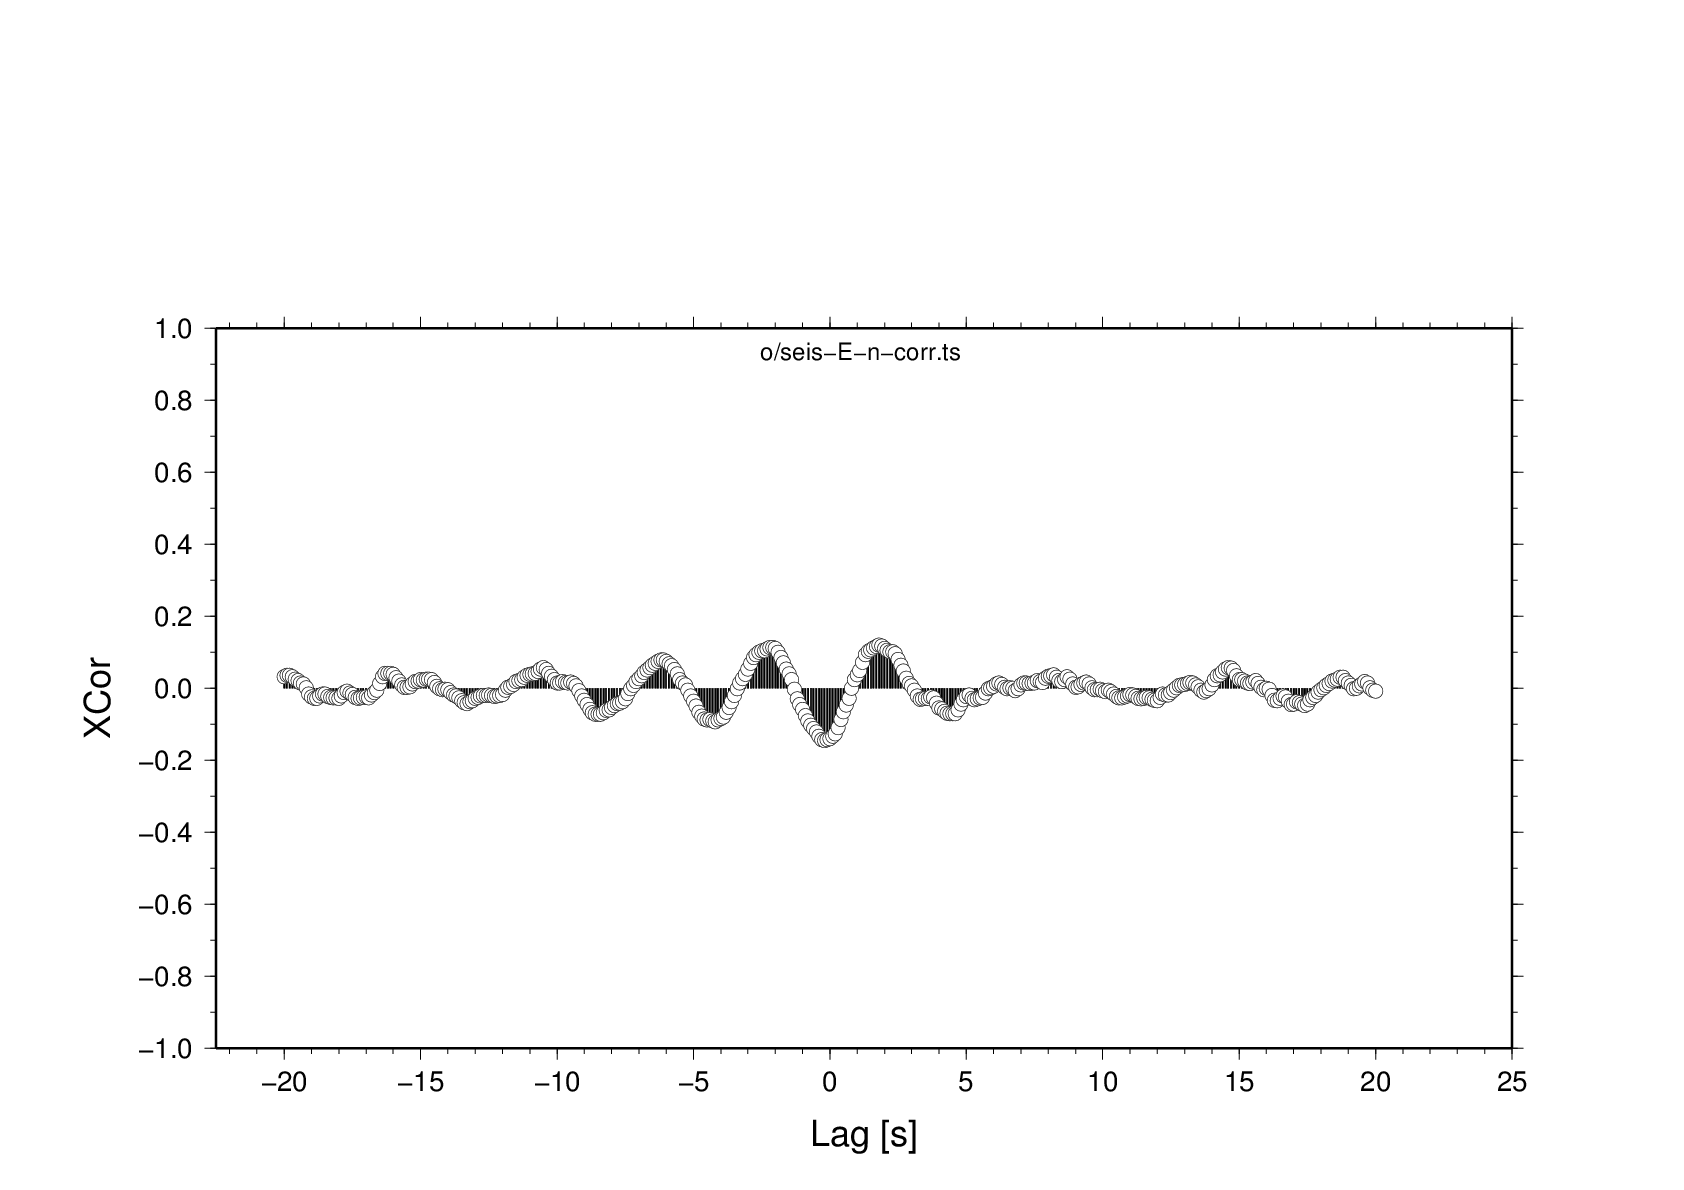 seis-E-n-corr.png
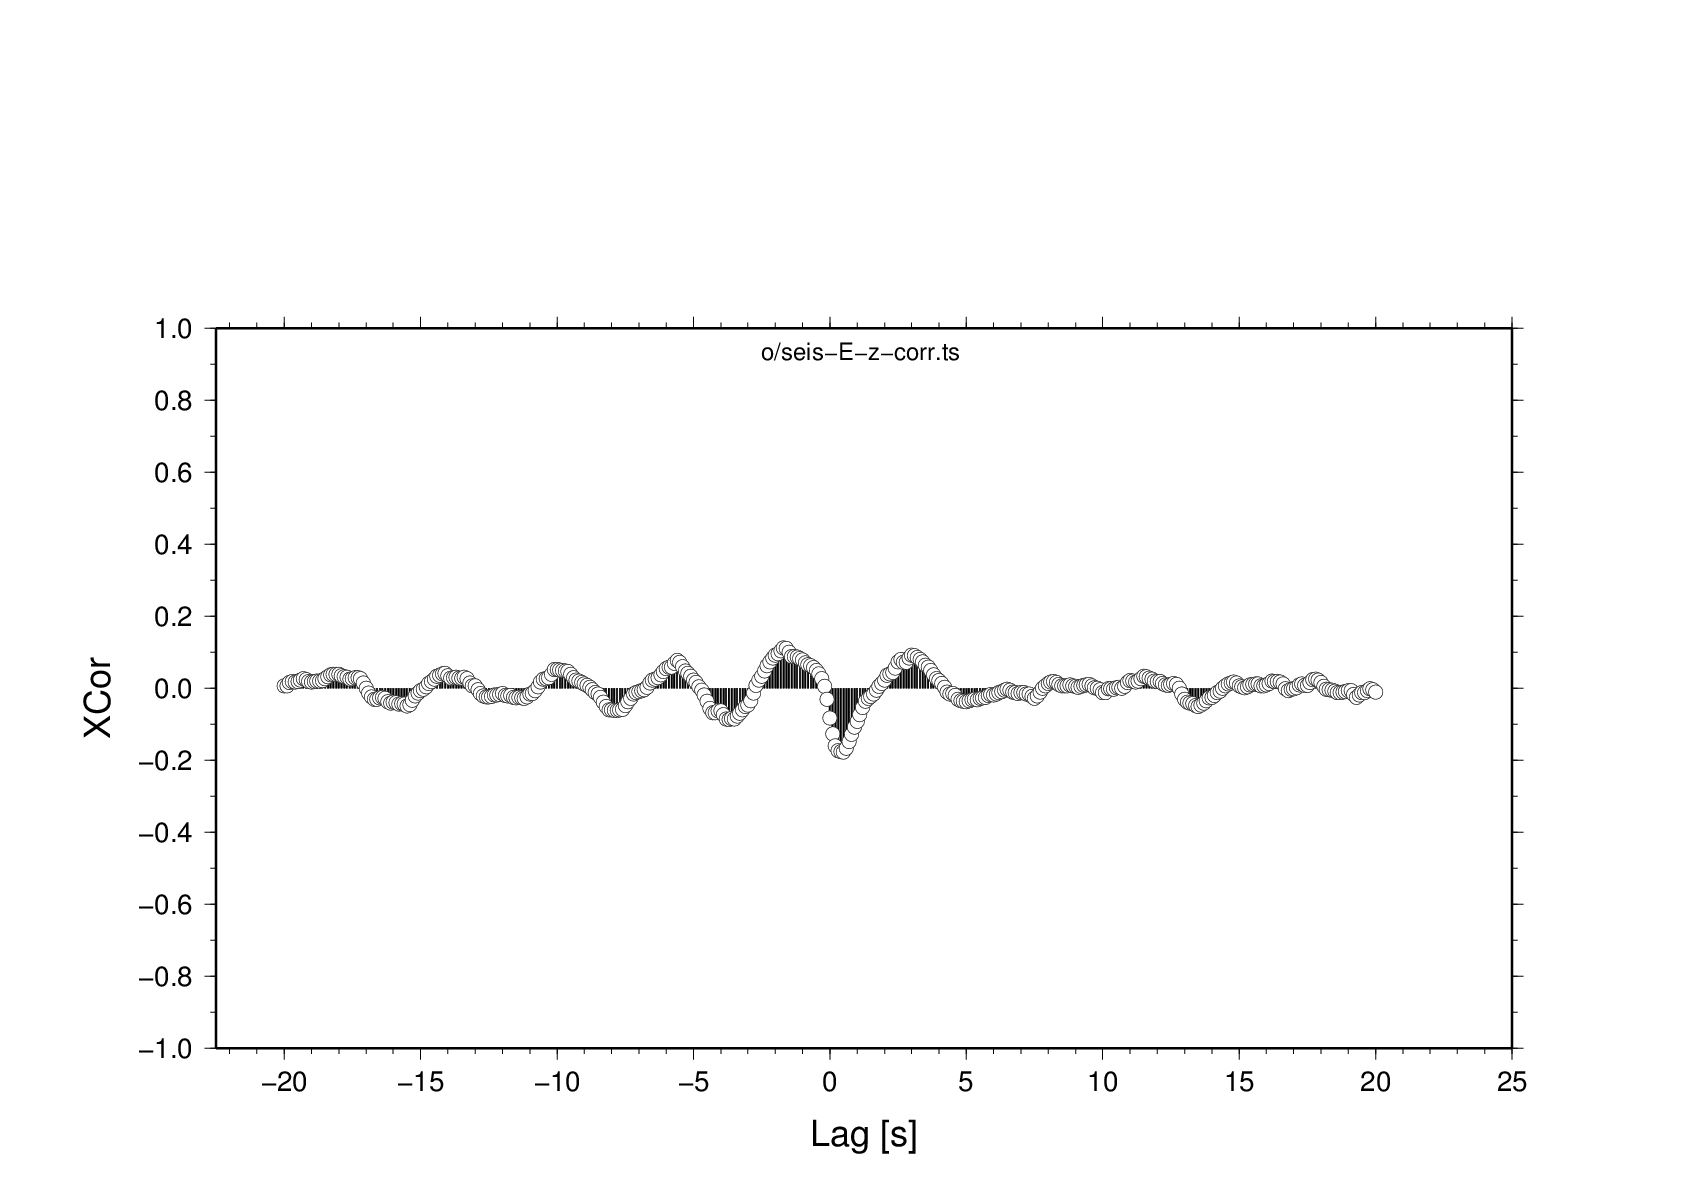 seis-E-z-corr.png
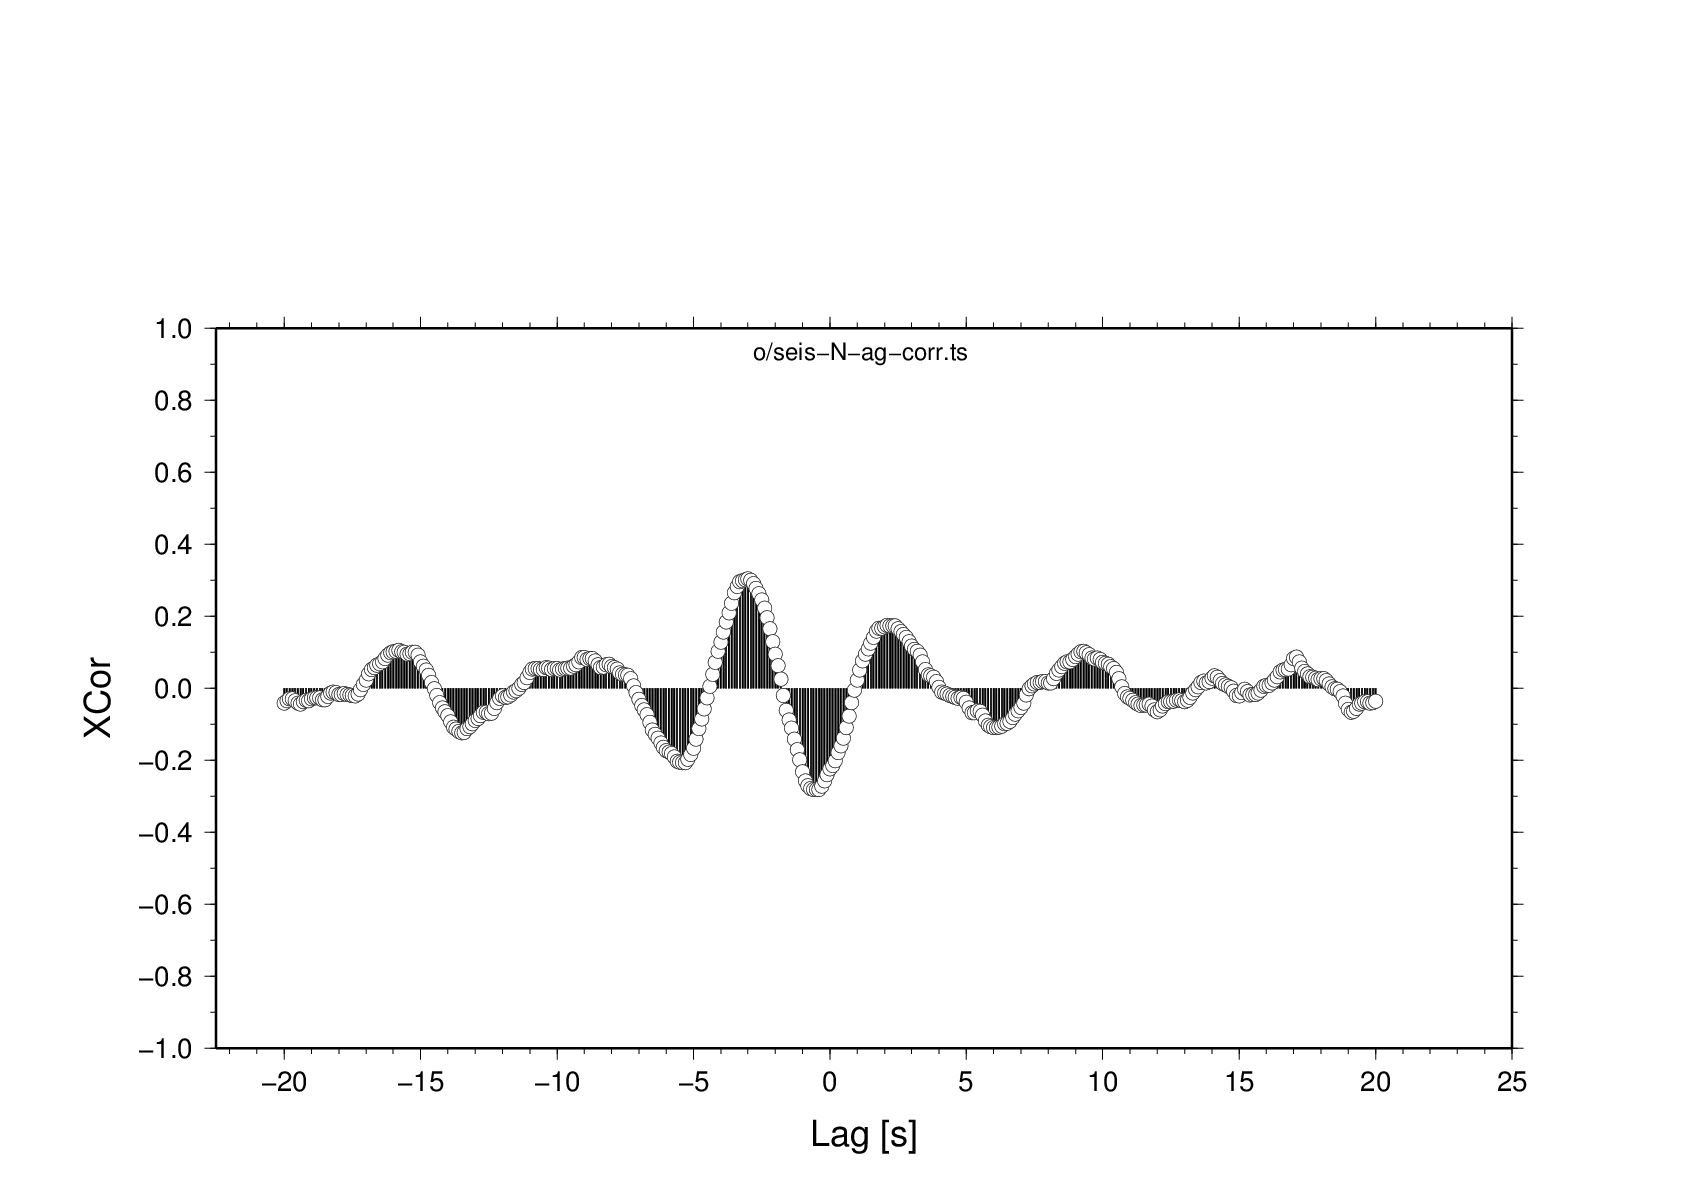 seis-N-ag-corr.png
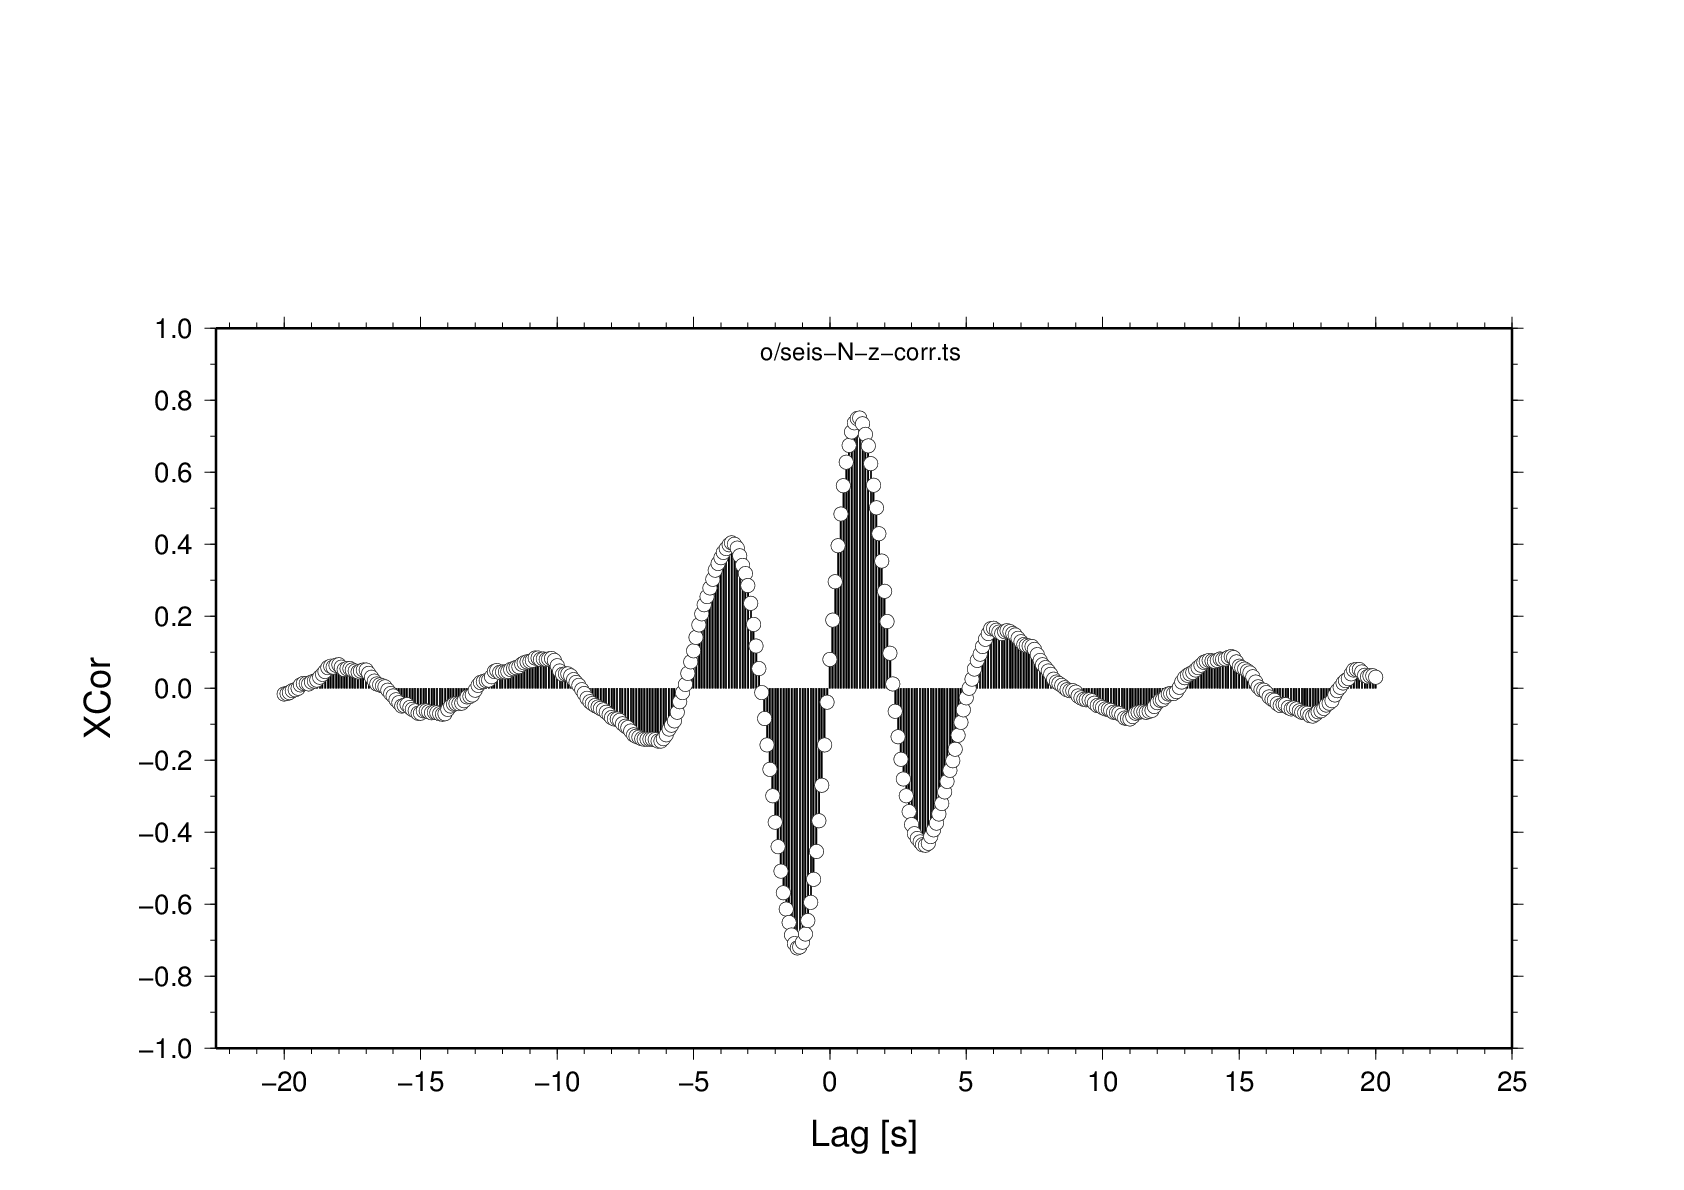 seis-N-z-corr.png
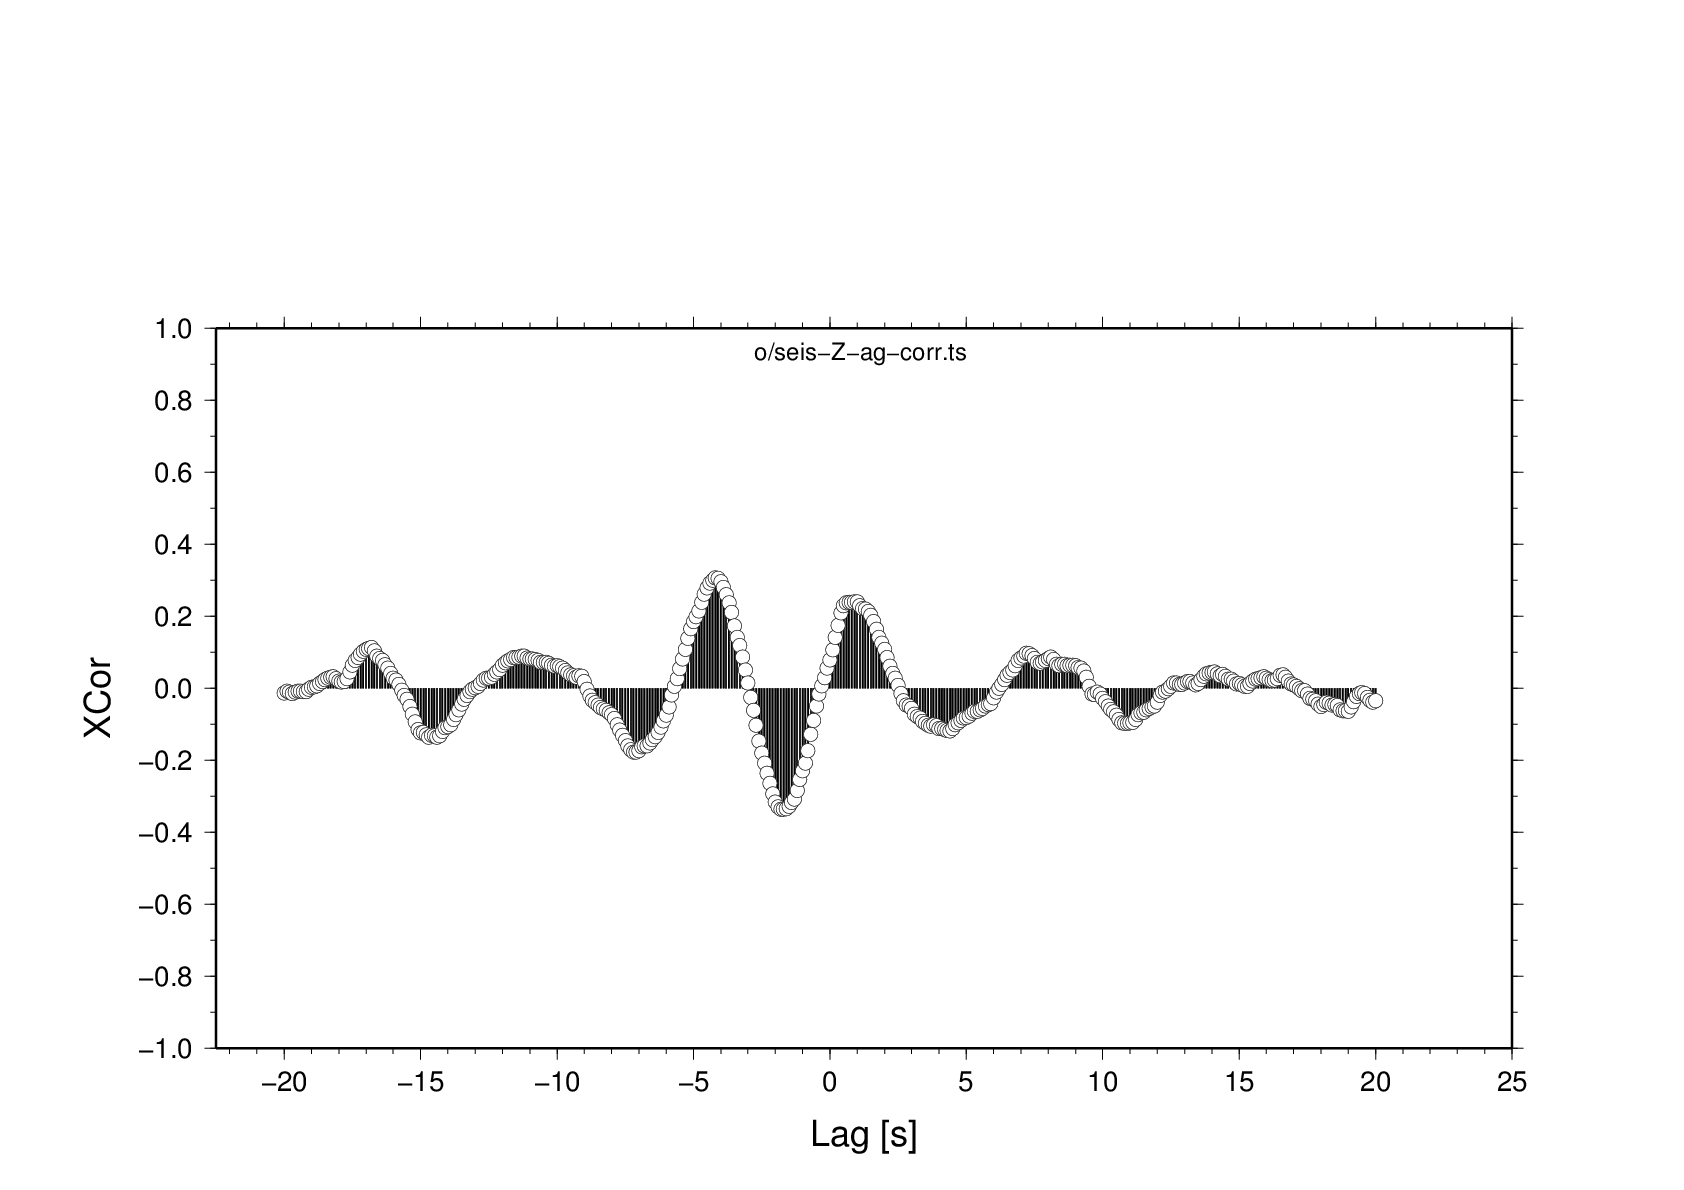 seis-Z-ag-corr.png
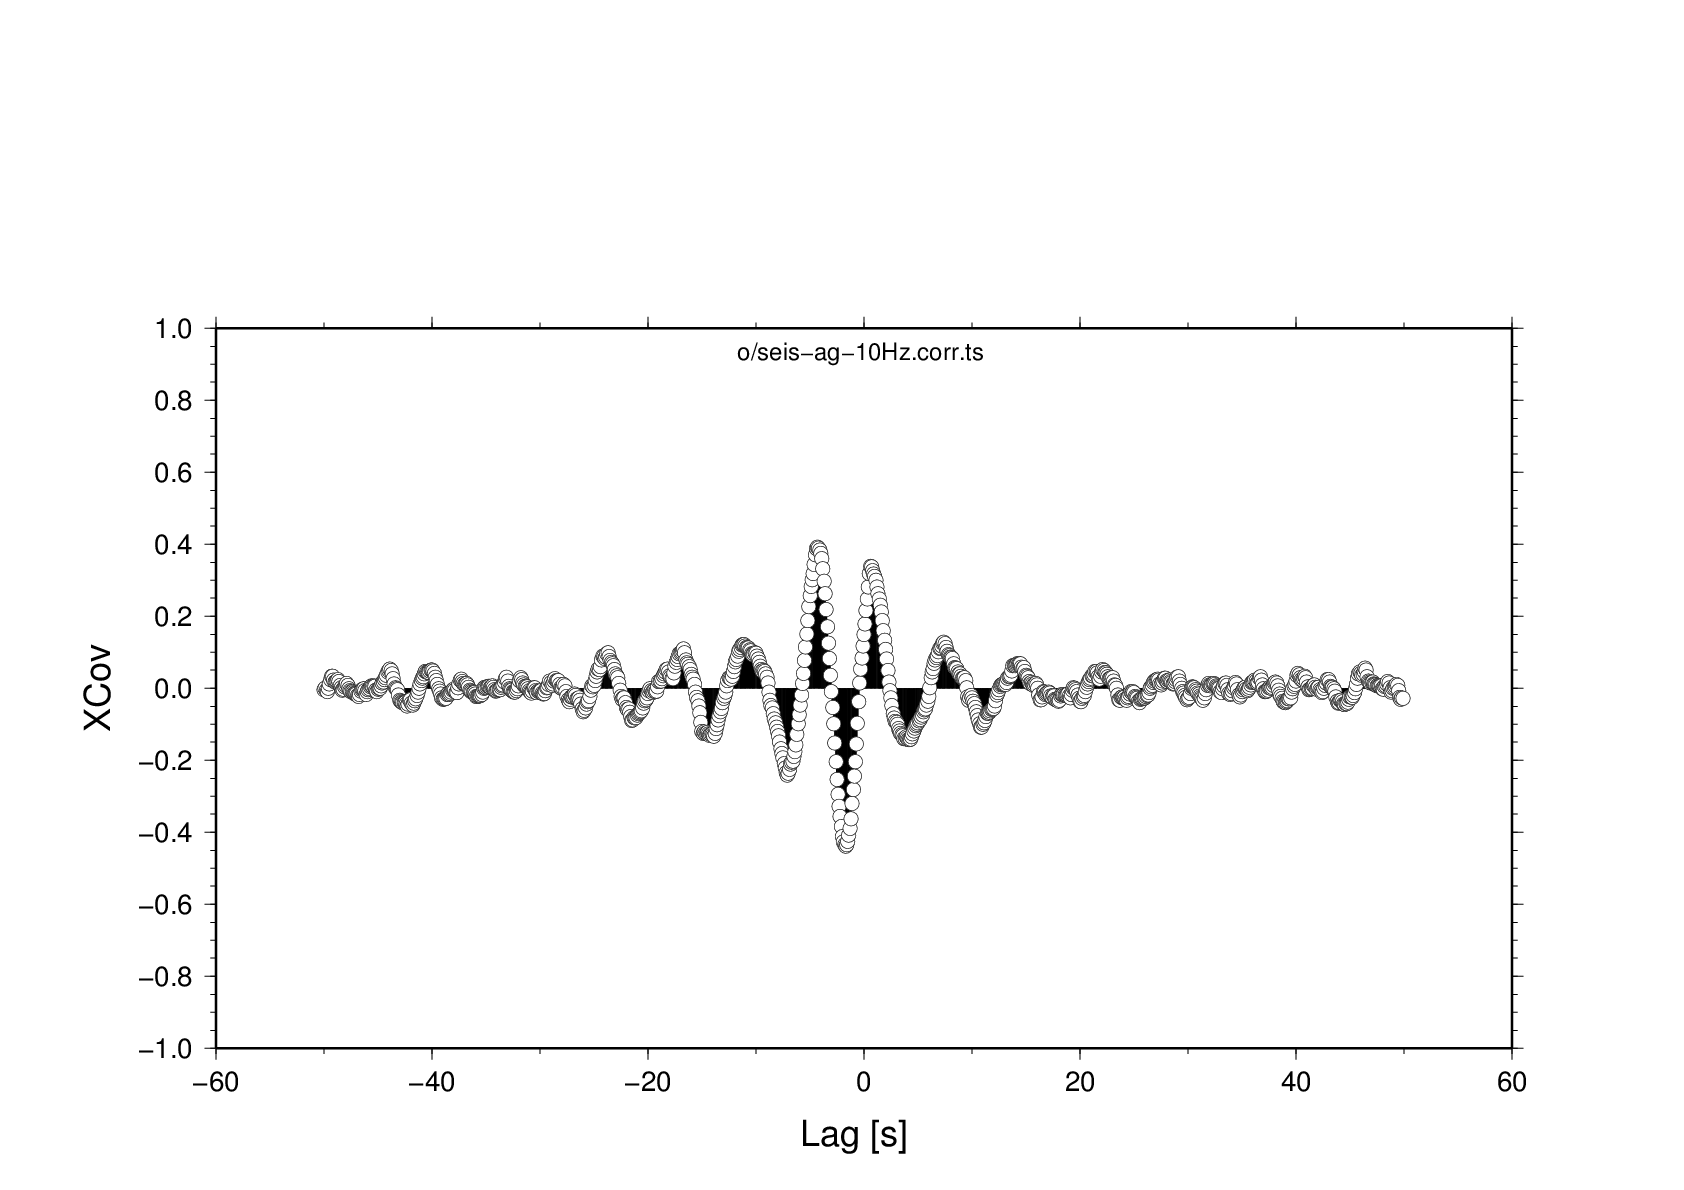 seis-ag-10Hz.corr.png
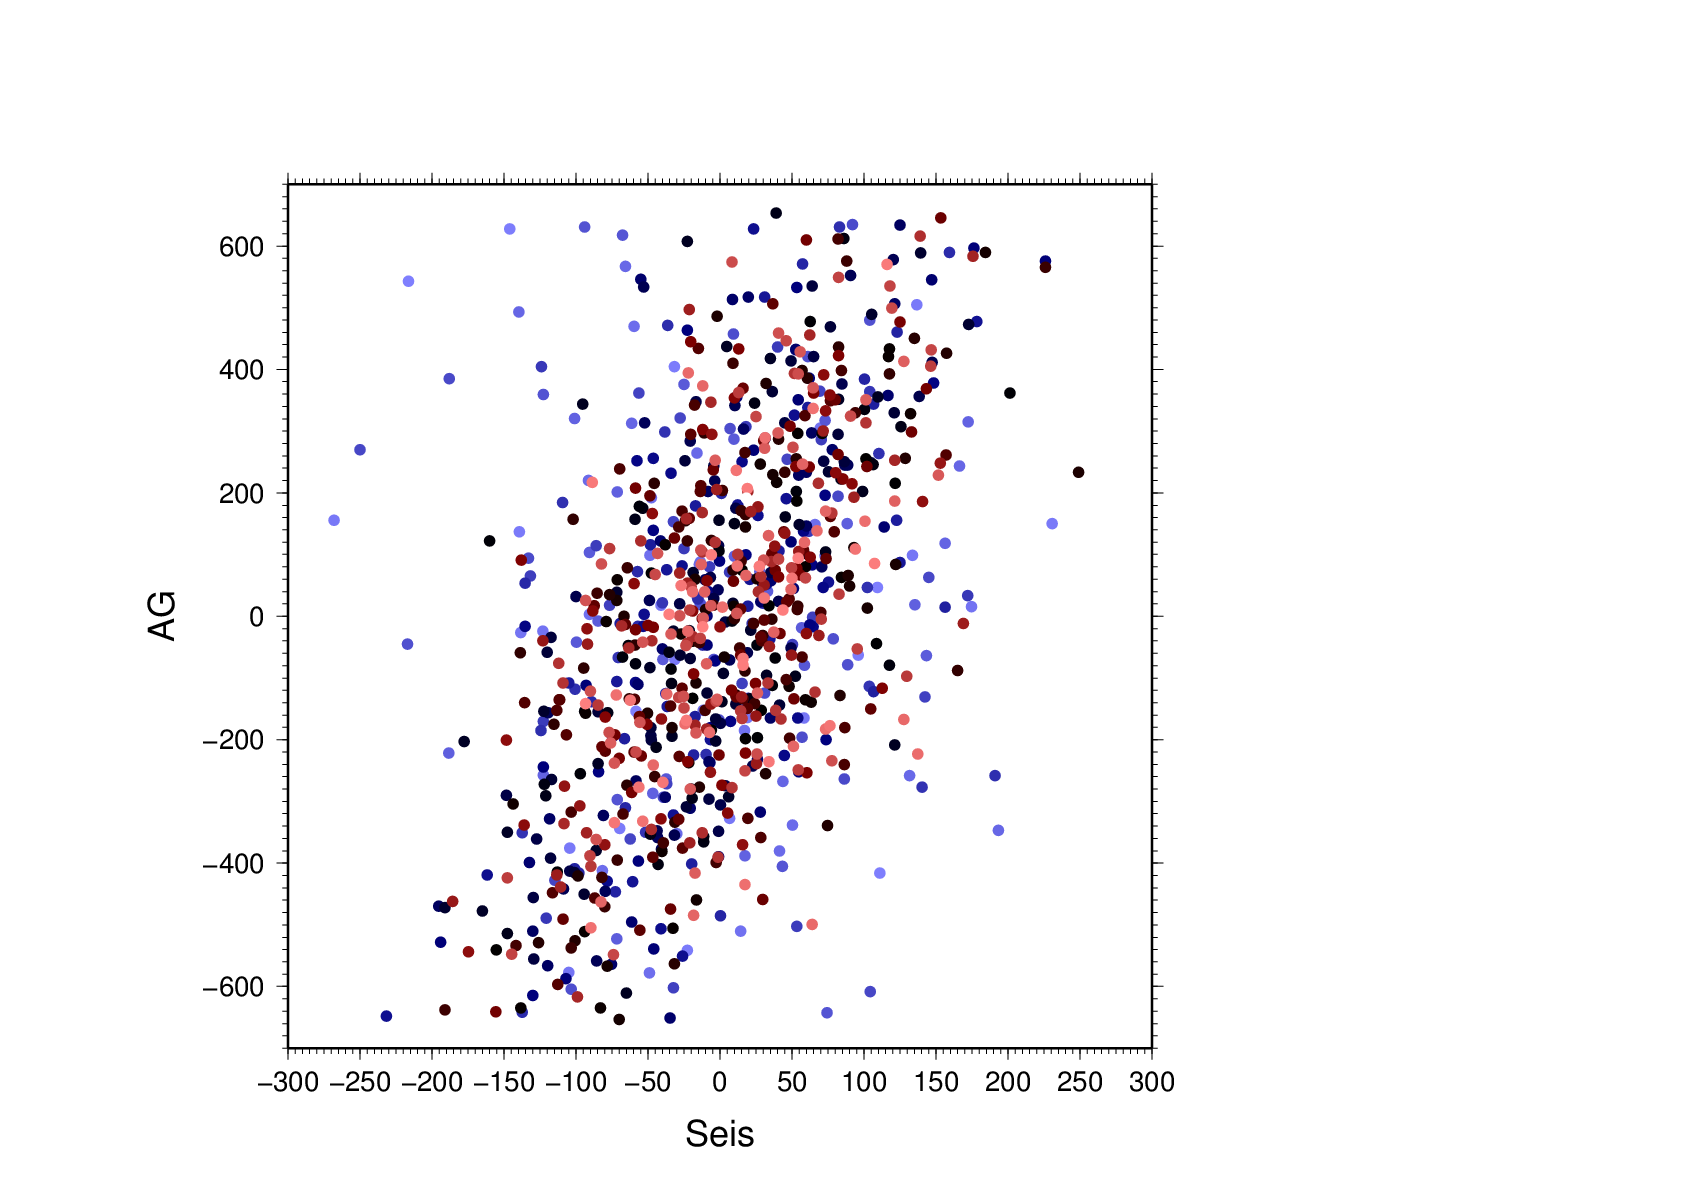 seis-ag-150207-scatp.png
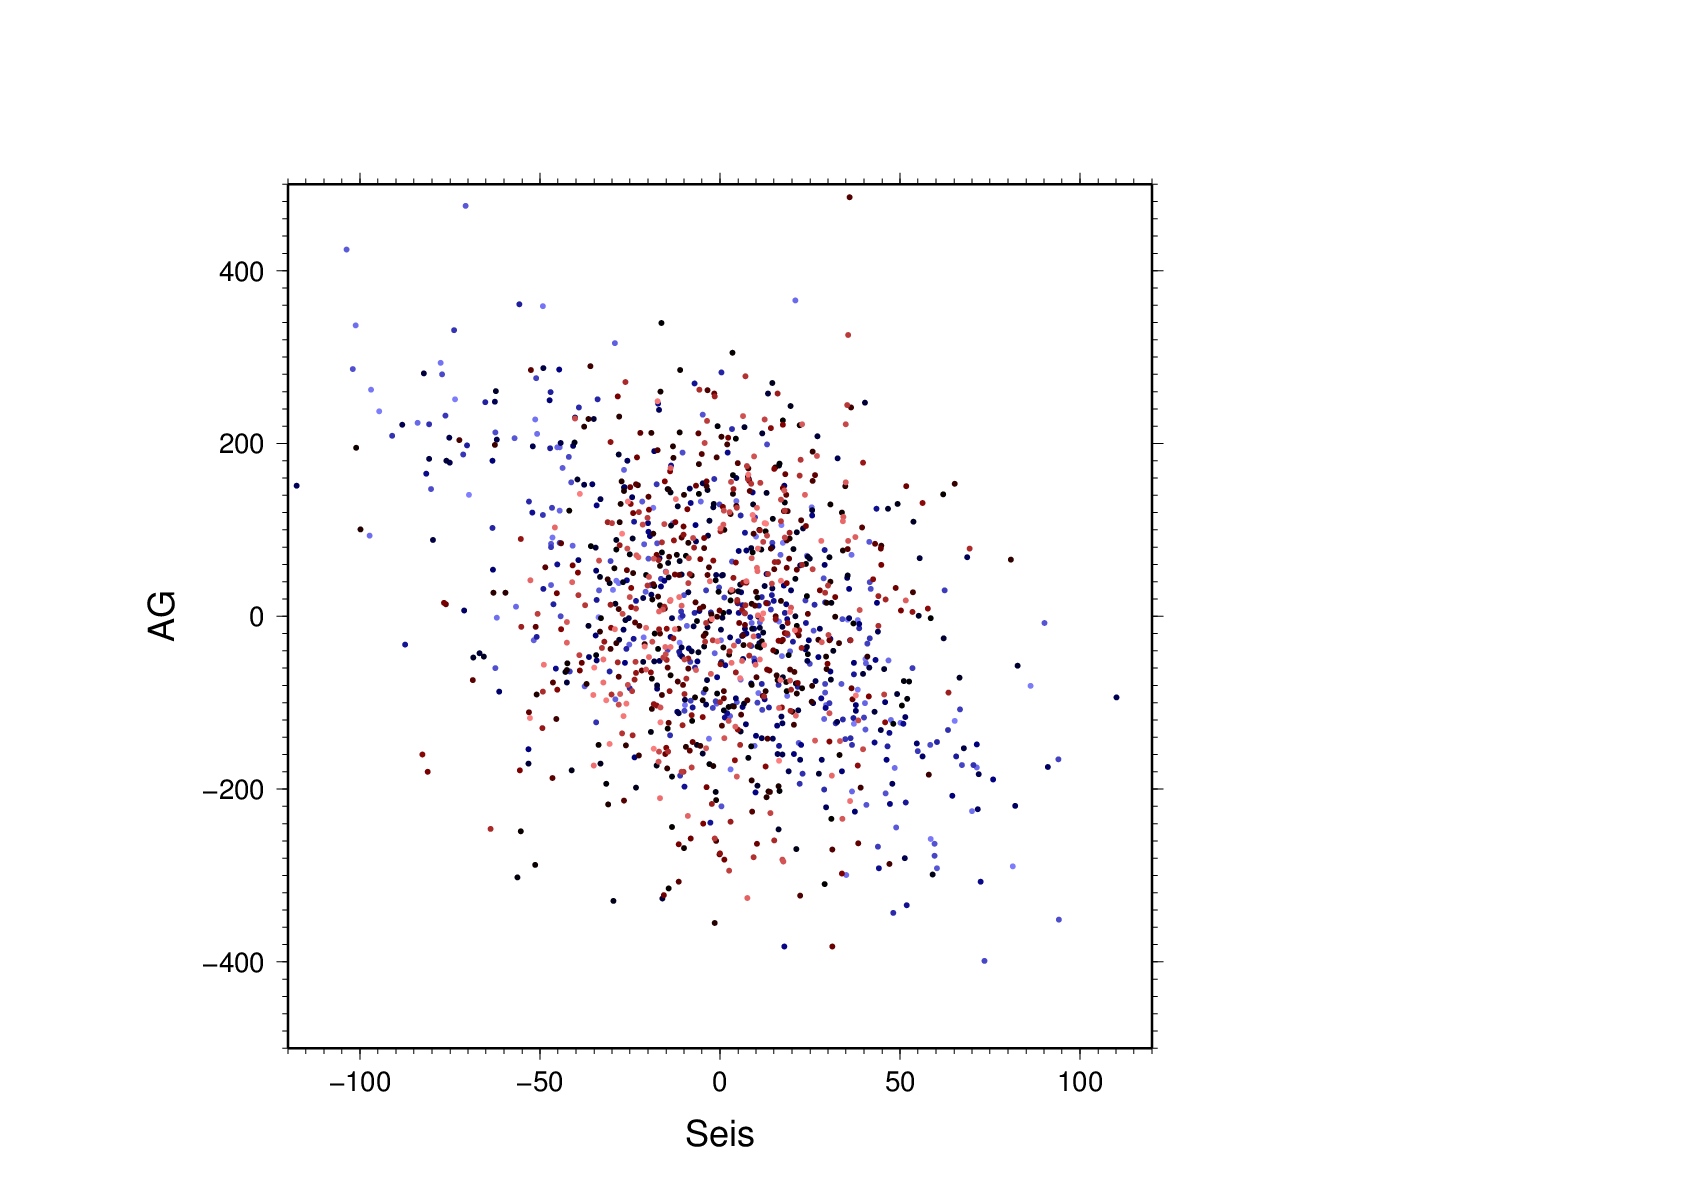 seis-ag-150212-scatp.png
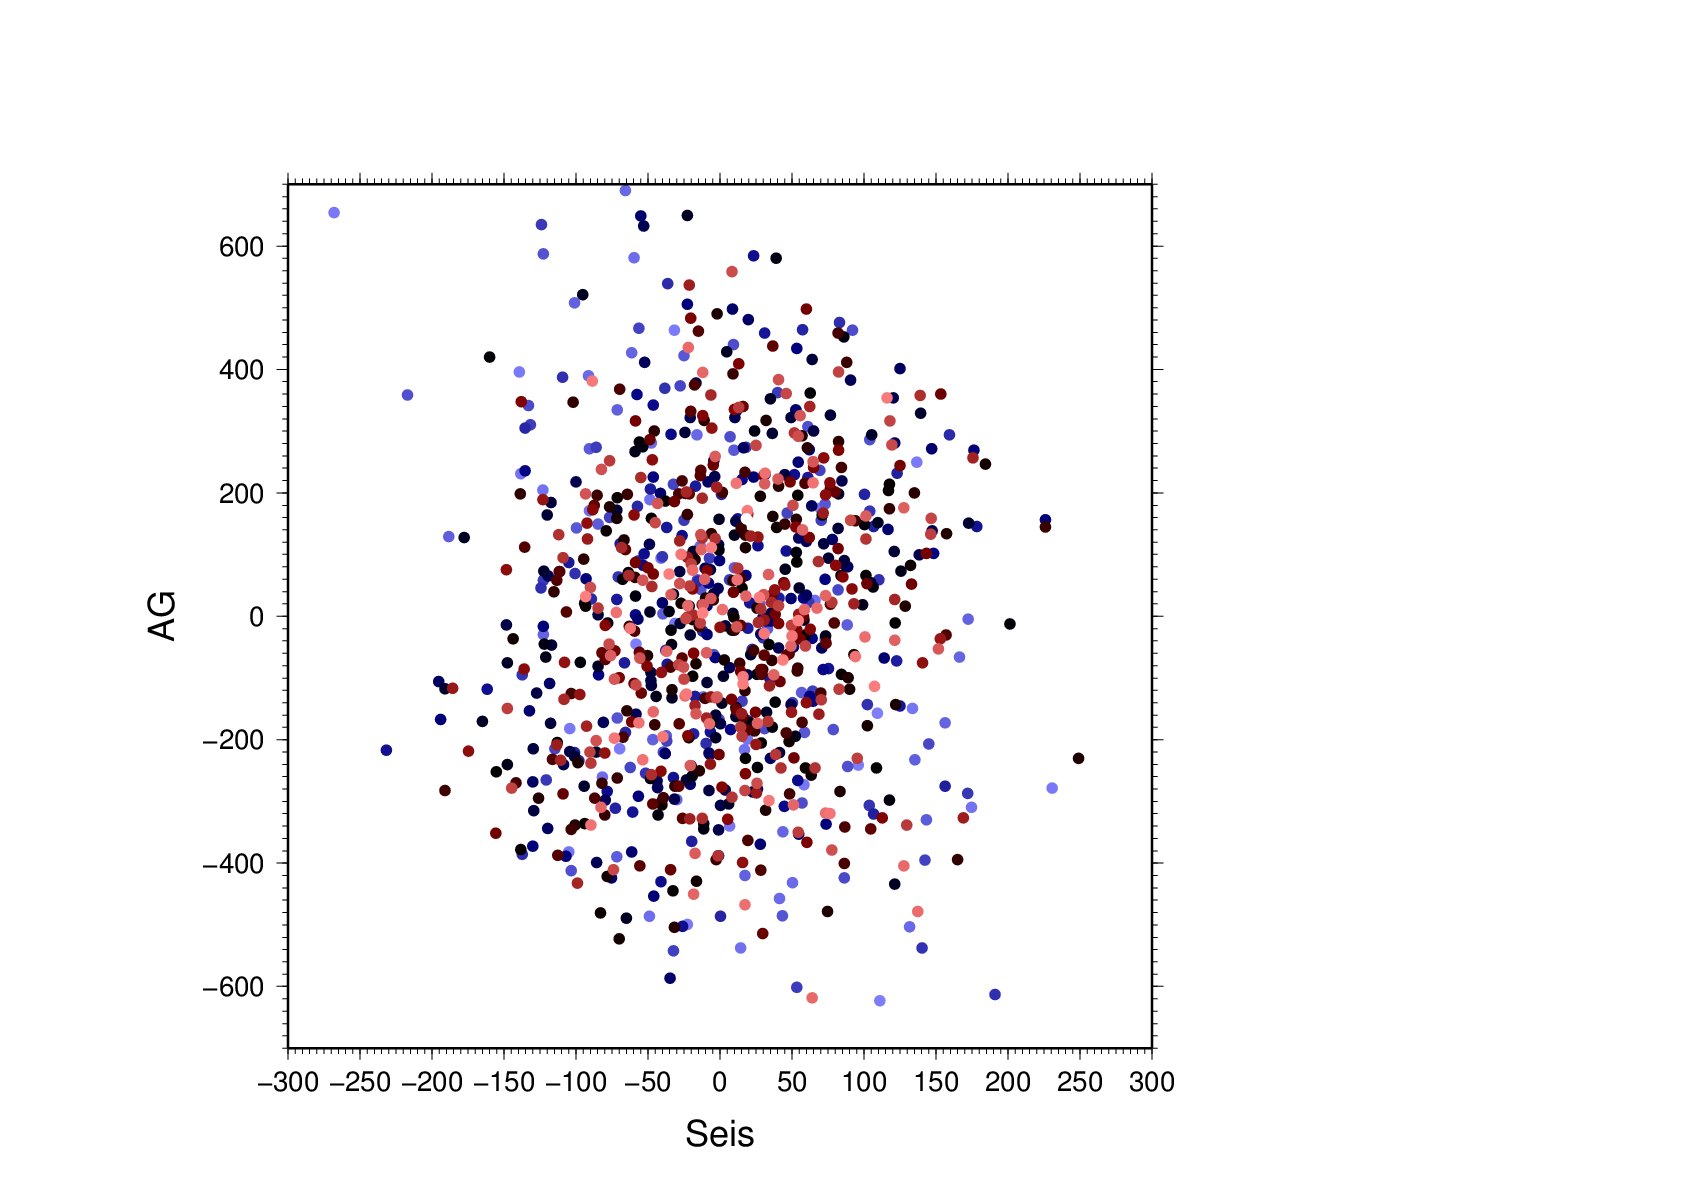 seis-ag-res-150207-scatp.png
 seis-ag-res-150212-scatp.png
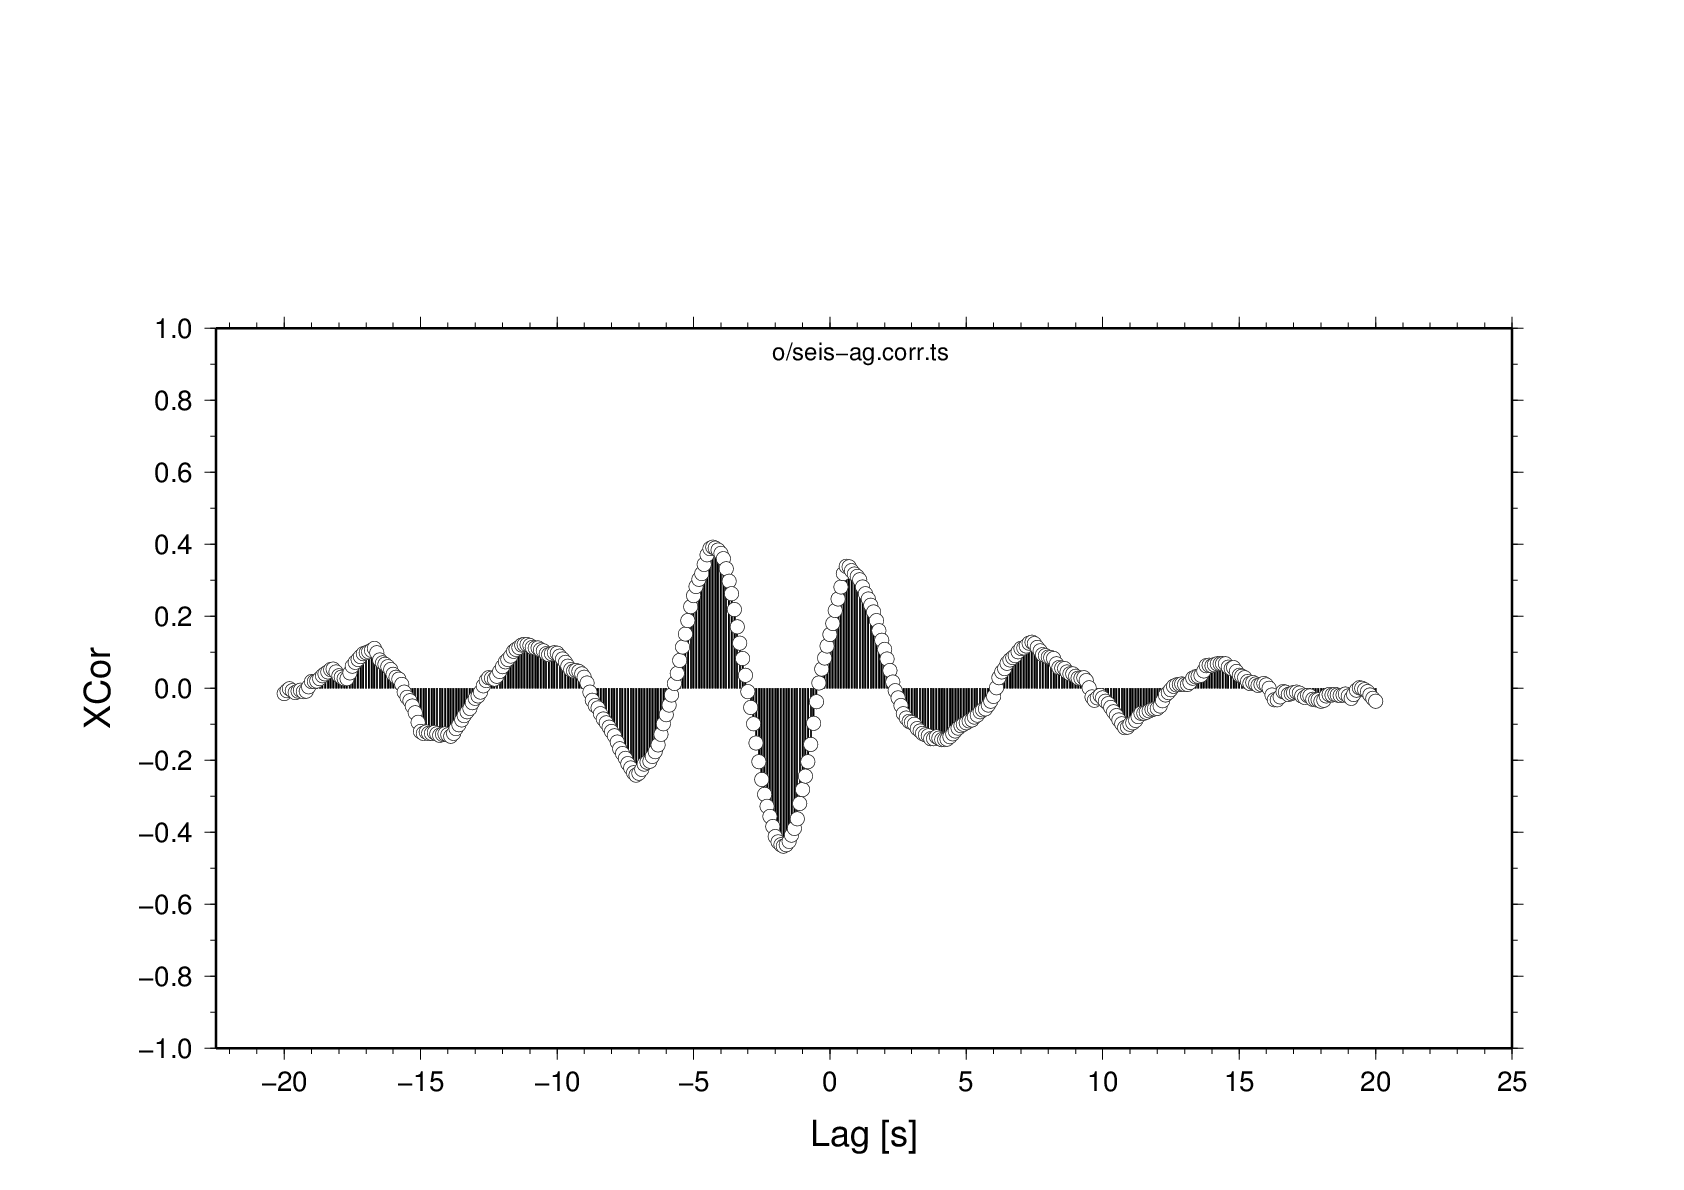 seis-ag.corr.png
 seis-gwn-10Hz.corr.png
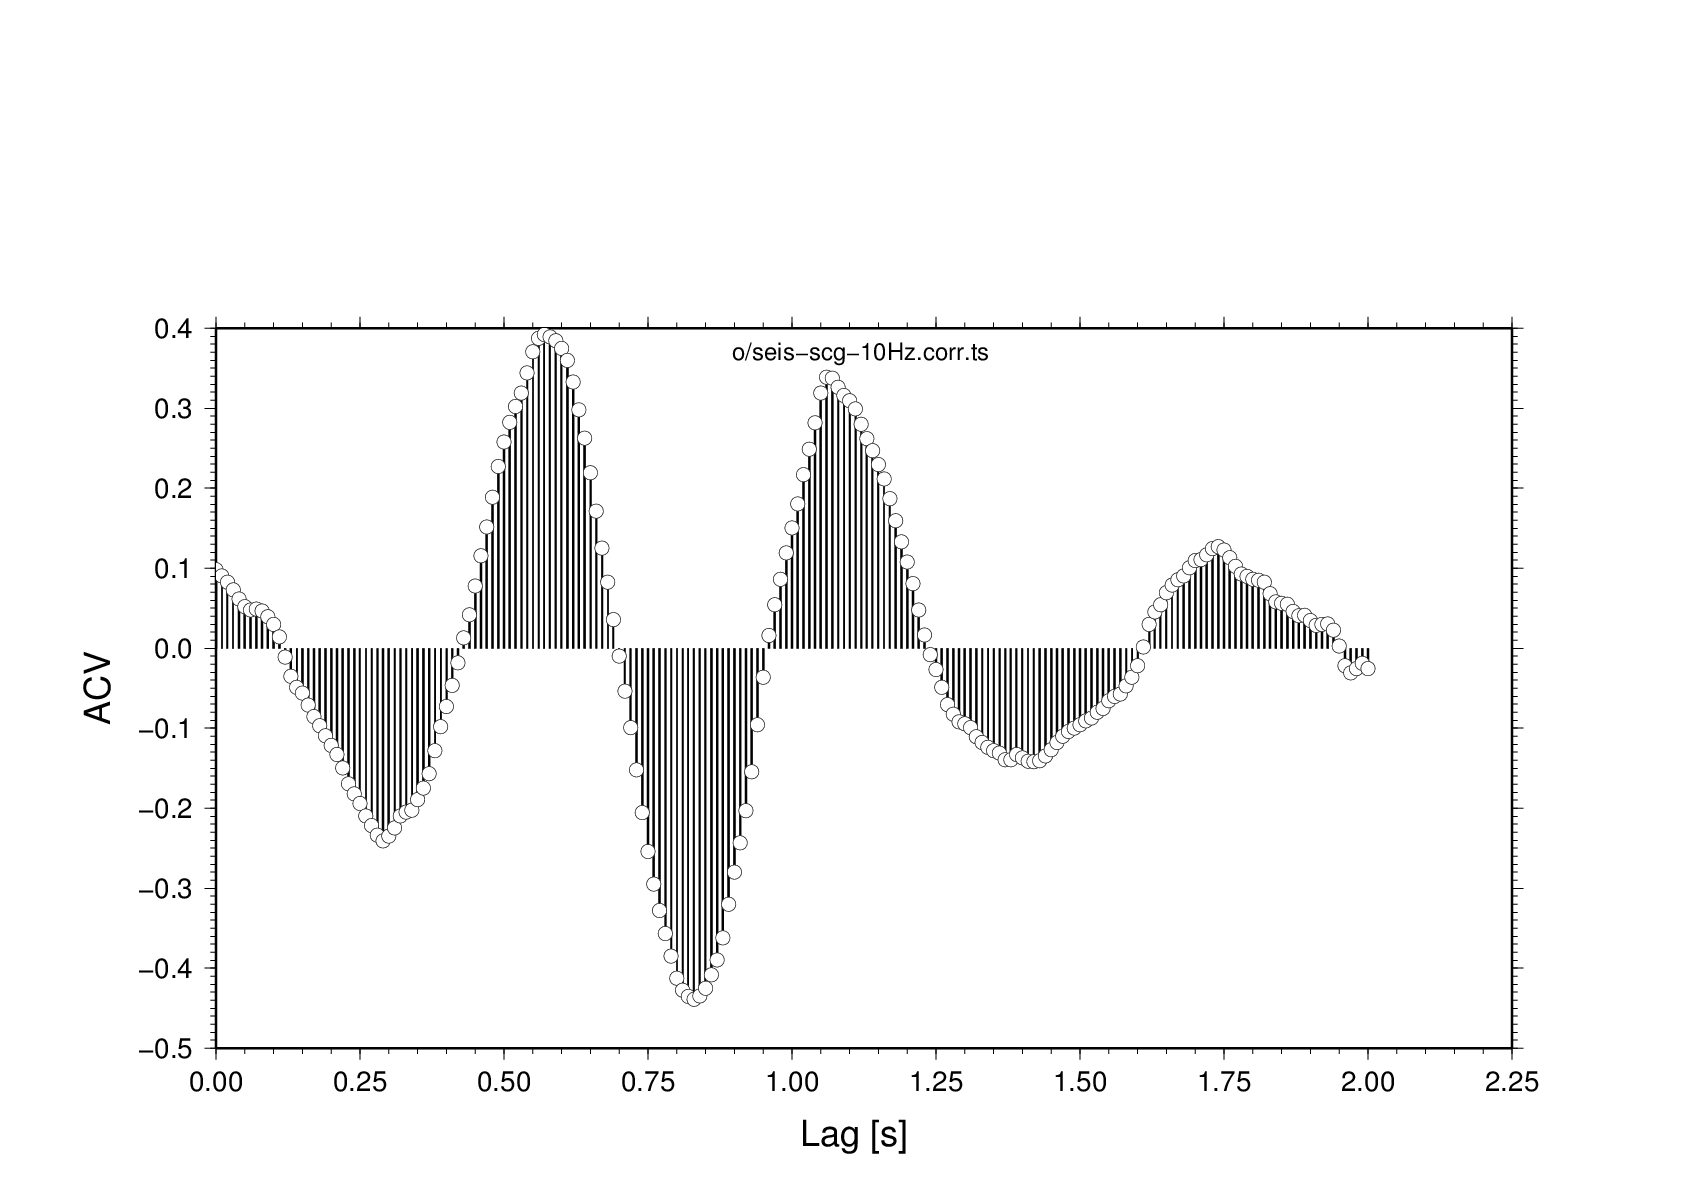 seis-scg-10Hz.corr.png
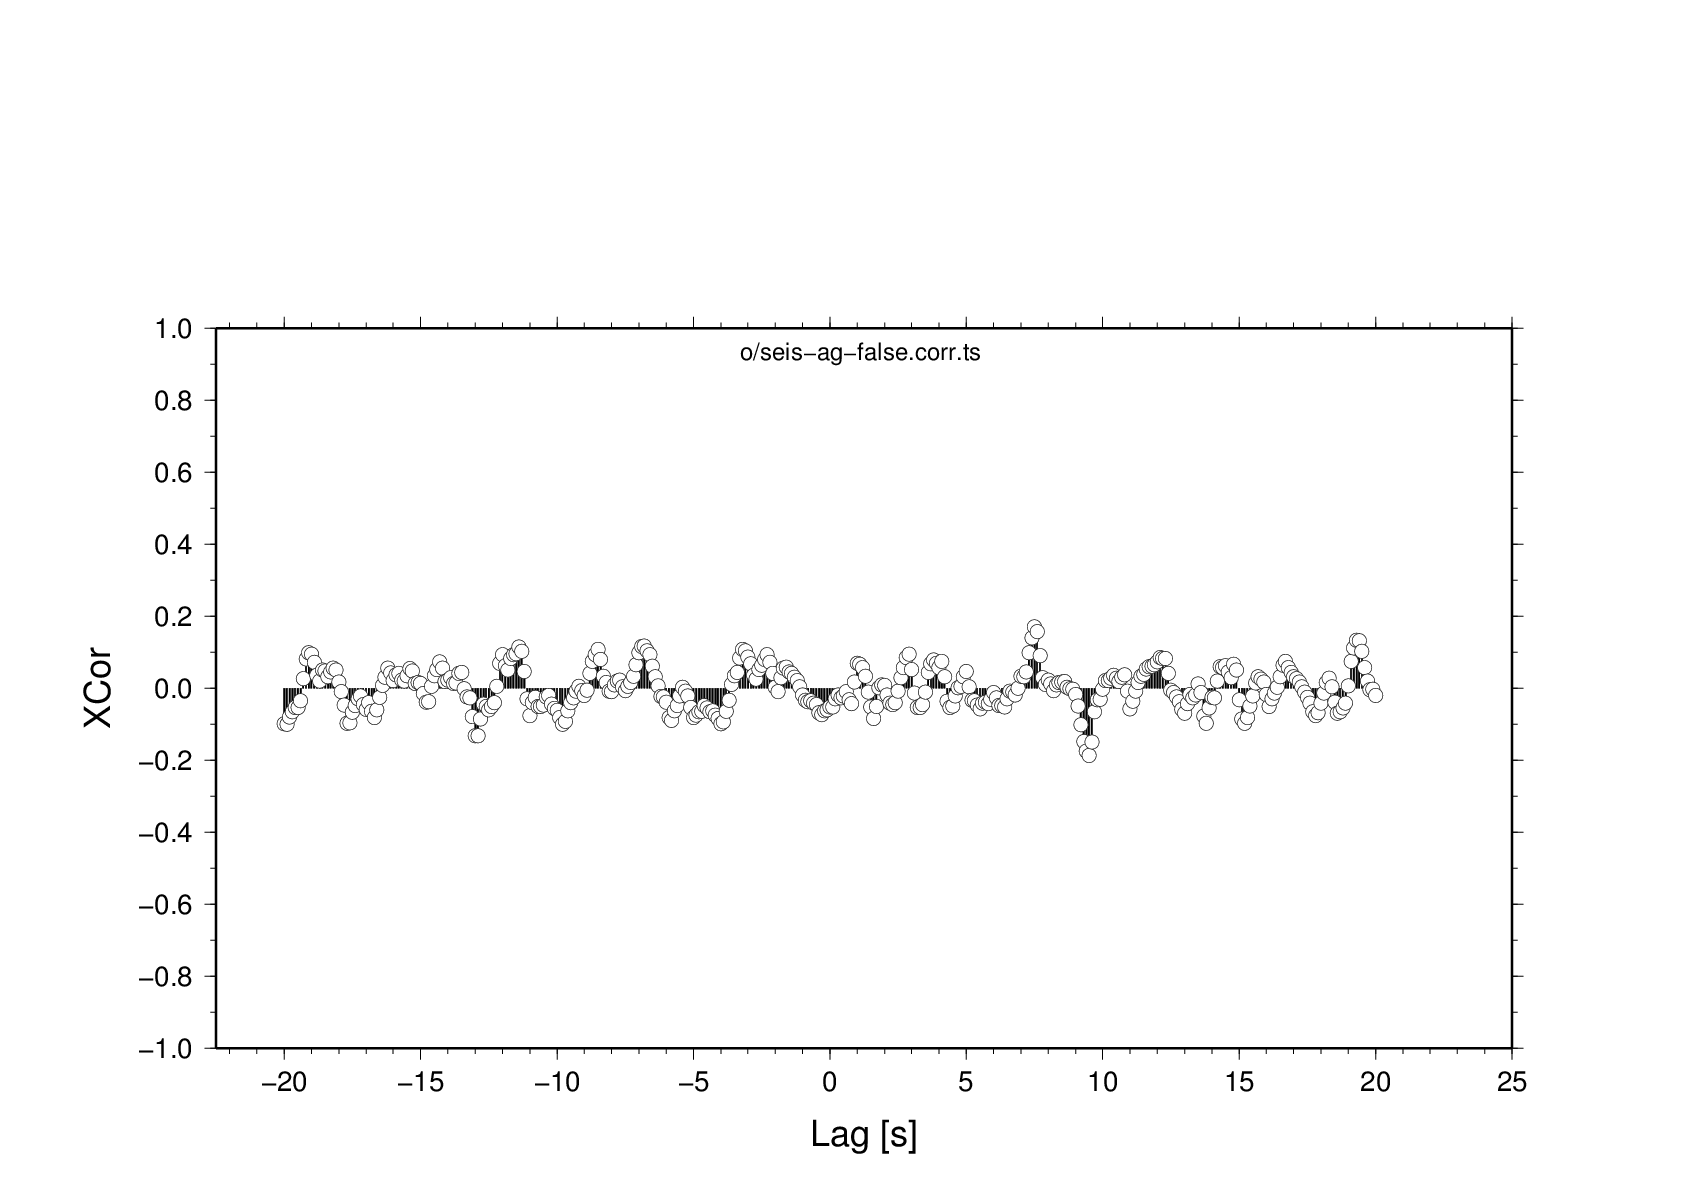 seis-ag-false.corr.png
 seis-scg.png
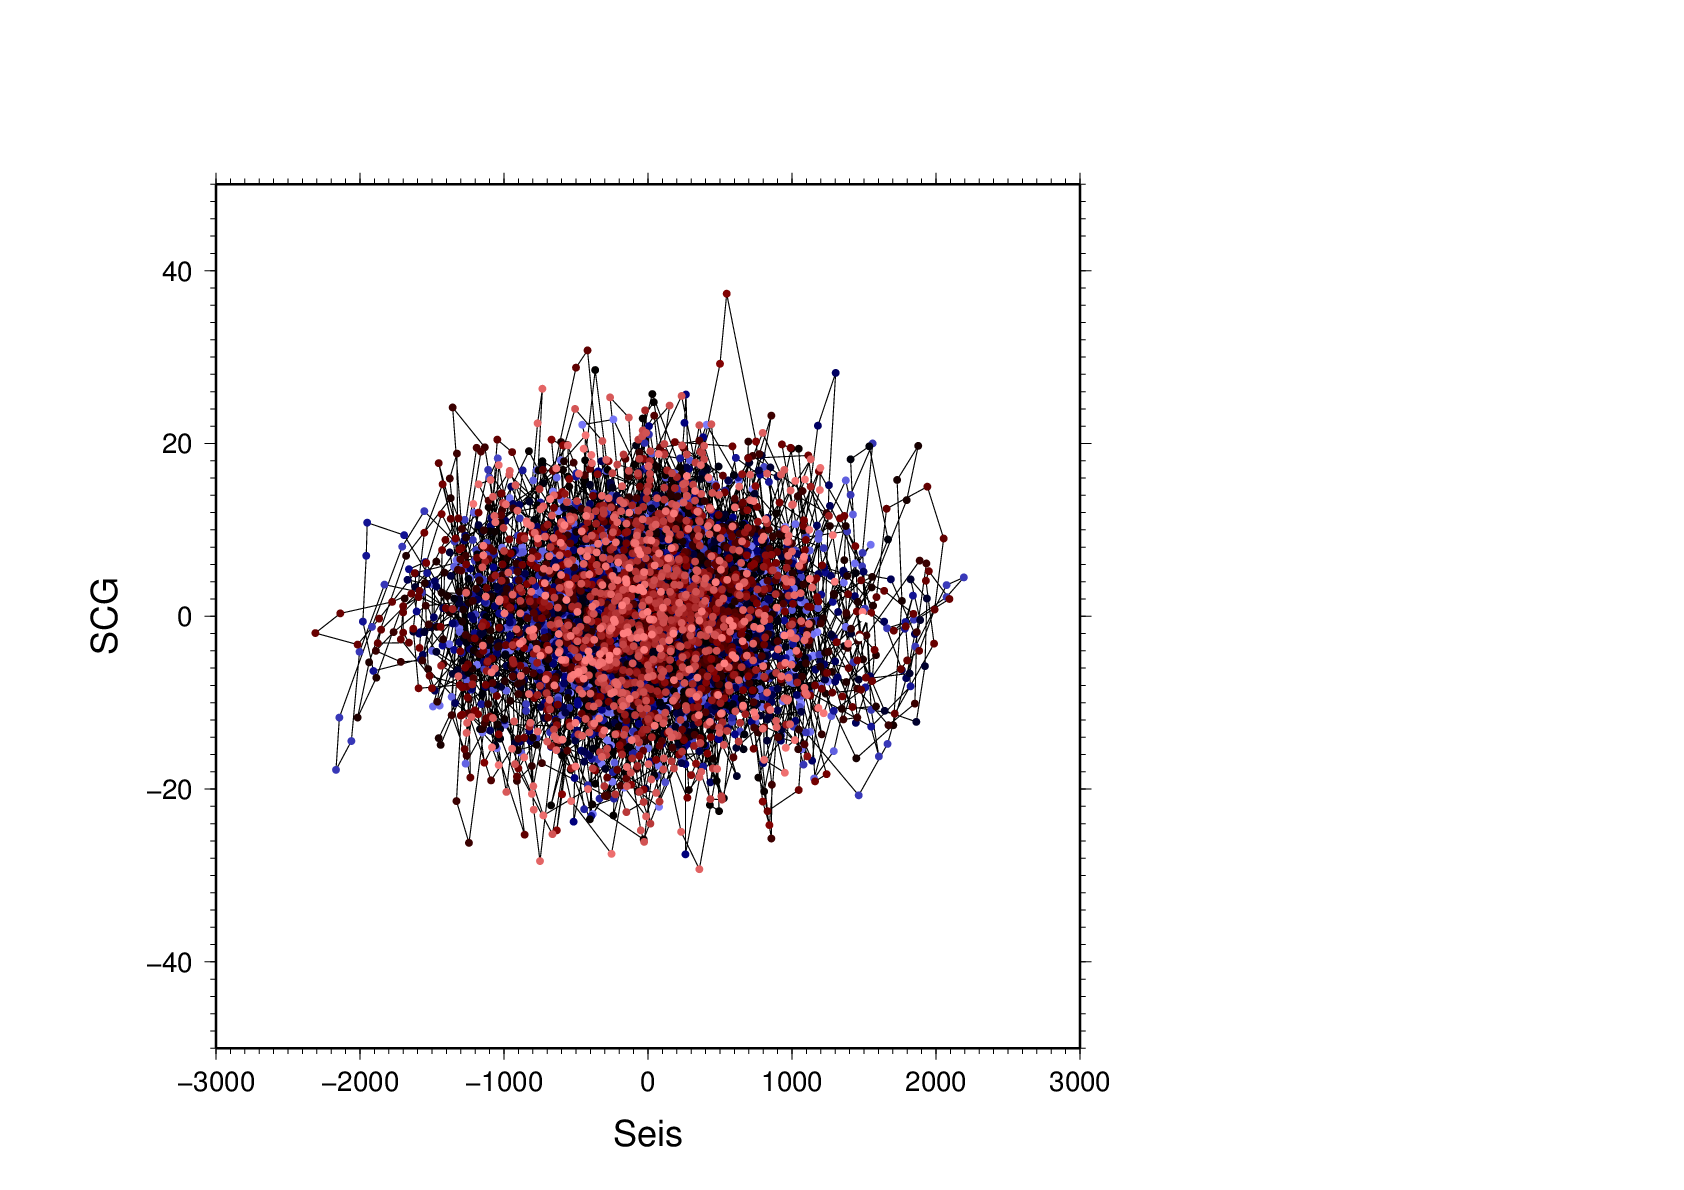 seisunfilt-scg.png