The earthquake at Kamchatka July 30, 2025
23:24:51 UTC, has generated significant Free Oscillations.
We list a few links where you can see the response of the
Superconducting Gravimeter OSG_054 at Onsala Space Obeservatory.
Waveforms
Diagrams, acceleration in nm/s2, can be seen here: SCG-monitor
In the fields to fill out you can easily advance at full hours by
entering date 2025-07-30, hour 00, and dt 60 and then clicking
on Submit query.
The ringing in the light-blue curve, dP/dt in hPa/s, at
midnight is an artefact of Fourier interpolation. It recurs
systematically. Awaiting the re-hooking of the OSG accompanying
barometer soon to happen, the stand-in instrument that samples at
a lower rate is still in use, so we interpolate its record. Thanks
to the opportunity of the mega-seismic event the problem has been
noted---a little late though.
Spectrograms
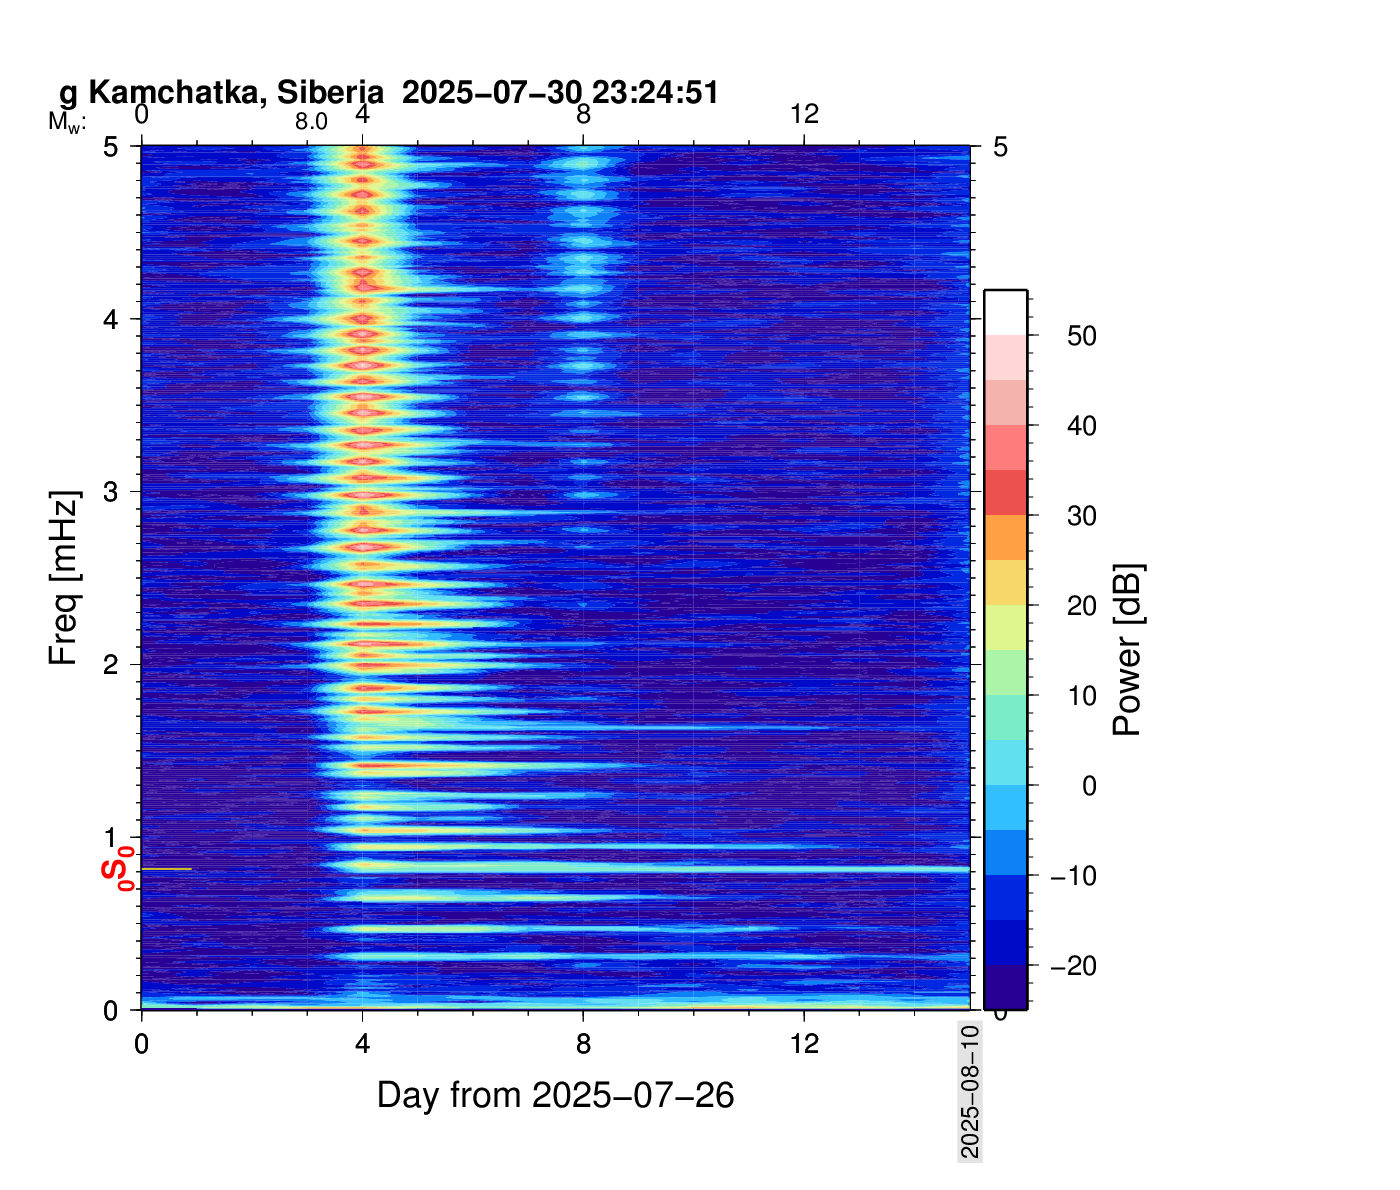
The spectrogram
has been renewed daily until the 0S0
mode waned below the noise level on Oct. 19, 2025. It's the balloon mode
with very little energy dissipation, since sheer strain in the
mantle is mostly confined to internal and the crust-ocean boundaries.
The event on day 43 (Sep. 9) was caused by a coldhead change.
Periodograms showing the amplitude spectrum up to 6
mHz and 3
mHz with periodograms added for four-day stretches the
week after the earthquake.
Another
one shows the spectrum for the period from July 31 to
August 3 together with the situation in the week before the
earthquake.