
BIFROST
Baseline Inferences from Fennoscandian Rebound Observations,
Sealevel and Tectonics
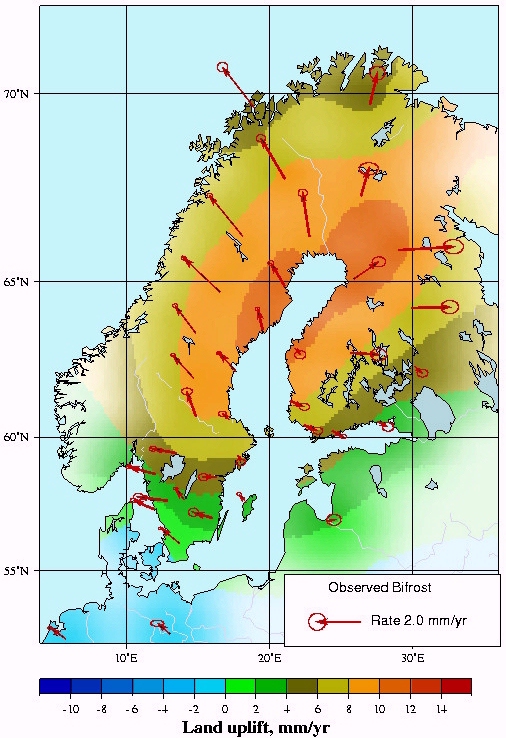
In this project we attempt to observe
the slow deformation of
Fennoscandia. It appears that the motion can accuratedly be reconciled
with a model of glacial isostatic adjustment. Our observational tools
are Space Geodesy, mostly GPS, continuously observing in the permanent
site networks of our area.
Solution 2001
Below we make available the motion
solution described in Johansson et al. (2002), the "official" Bifrost
solution 2001.
Using this data:
The results shown in this file go together with the JGR article by
Johansson
et al. (2002). Please reference this article if you base scientific
conclusions on the data contained or linked through this internet page.
Johansson, J.M., J.L. Davis, H.-G. Scherneck, G.A.
Milne,
M. Vermeer, J.X. Mitrovica, R.A. Bennett, G. Elgered, P.
Elósegui,
H. Koivula, M. Poutanen, B.O. Rönnäng, and I.I. Shapiro, 2002:
Continuous GPS measurements of postglacial adjustment in
Fennoscandia,
1. Geodetic Results,
J. Geophys. Res., Vol. 107, No. B8, DOI
10.1029/2001JB000400,
2002
Small changes with respect to the numbers shown in the article may
occur uncommented.
Reason: Evolving strategies.
The 3-D velocity solution has been compared with a glacial
isostatic
adjustment model and different ice and ocean load histories in the
follwong paper:
Milne, G.M., J. L. Davis, Jerry X. Mitrovica,
H.-G.
Scherneck, J. M. Johansson, M. Vermeer, H. Koivula,
Space-Geodetic Constraints on Glacial Isostatic Adjustment in
Fennoscandia,
Science, Vol. 291, 2001
A review of the BIFROST project's first
eight years is contained in:
Scherneck, H.-G., J.M. Johansson, G. Elgered, J.L.
Davis,
B. Jonsson, G. Hedling,
H. Koivula, M. Ollikainen, M. Poutanen, M. Vermeer, J.X.
Mitrovica,
and G.A. Milne:
BIFROST: Observing the Three-Dimensional Deformation of
Fennoscandia
in: Ice Sheets, Sea Level and the Dynamic Earth,
Mitrovica,
J.X. and B.L.A. Vermeersen (eds), pp. 69-93
AGU Geodynamics Series, Vol. 29, American Geophysical Union,
Washington,
D.C., 2002.
Publication 2003
Scherneck, H.-G., J.M. Johansson, H. Koivula, T. van
Dam, and
J.L.
Davis
Vertical crustal motion observed in
the BIFROST project,
Proceedings SRCM Helsinki, 2001, J. Geodynamics, 35, 425-441,
doi:10.1016/S0264-3707(03)00005-X, 2003.
In this publication we compared sea level rates with
GPS-derived vertical crustal motion in order to determine sea level
rise independent of local ground motion. We conclude this parameter to
be . Observe that this value is relevant for the North-Sea area of the
North Atlantic.
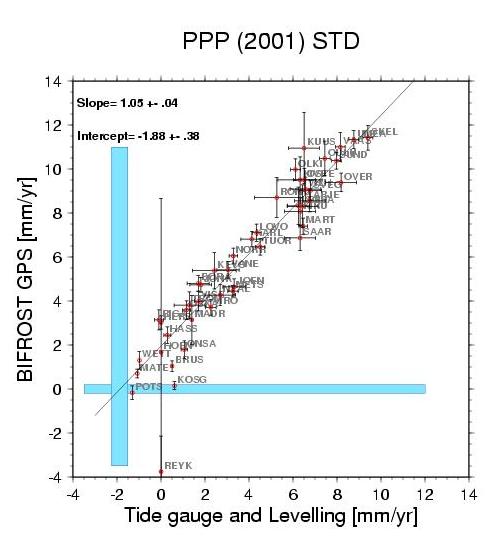
Comparison of GPS-derived vertical rates and rates based on tide
gauges. In order to estimate a sea level component that is independent
on the grround motion at the mareograph we (1) remove a geoid signature
from the tide gauge data and (2) compute the relation to GPS rates by
linear regression. At the locus where GPS rates are zero, i.e. at the
abscissa intercept, the tide gauges are seen to undergo a "land uplift"
of -1.9 mm/yr, i.e. a sea level rise of 1.9 mm/yr, with an uncertainty
(standard deviation) of 0.4 mm/yr.
|
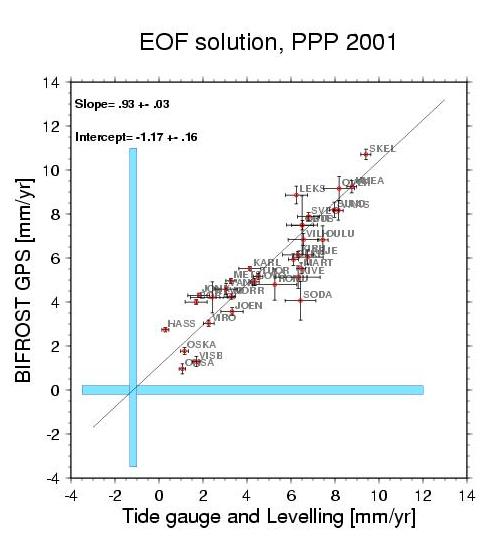
Using an Empirical Orthogonal Function approach to reduce common signal
from the vertical position estiamtes in the GPS time series, the
scatter and the uncertainties of the rate estimates are somewhat less.
The intercept is found at 1.2 mm/yr (sea level rise) with an
uncertainty of 0.3 mm/yr.
|
More links:
The Space Geodesy
group
at the Harvard-Smithsonian Center for Astrophysics, Cambridge, Mass.
More on us, the Space
Geodesy group at Onsala Space Observatory
The pages of the SWEPOS
network at the National Land Survey of Sweden
The Department
of Geodesy and Geodynamics at the Finnish
Geodetic Institute and their pages on the FinnRef
network
Link to a project presentation on BIFROST
(held at AGRET Paris, Nov. 1999).
Link to the Publication
list of the Space Geodesy Group at Chalmers/Onsala Space
Observatory.
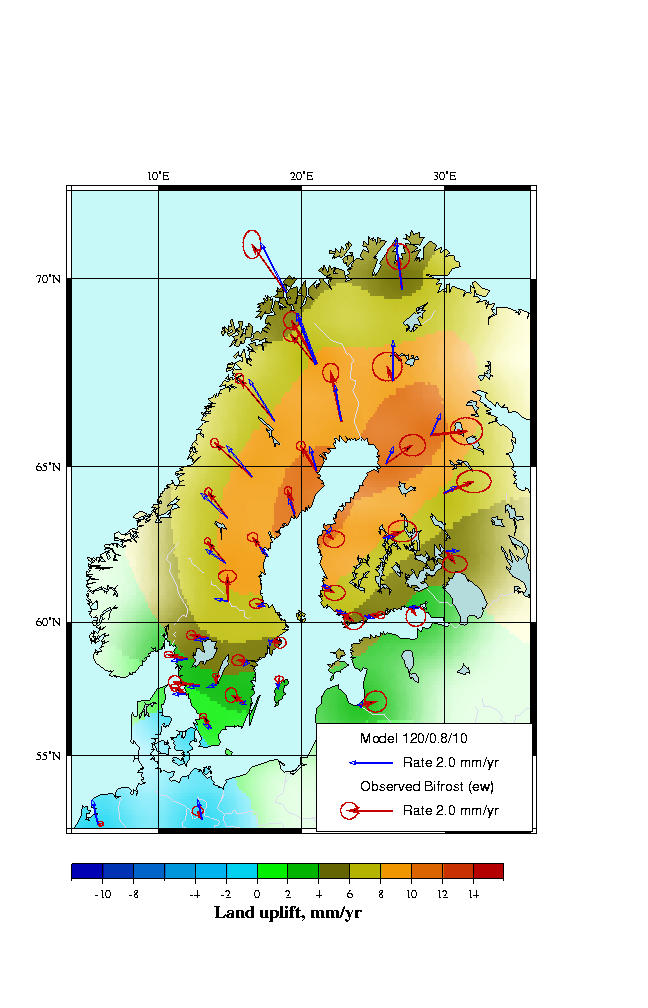
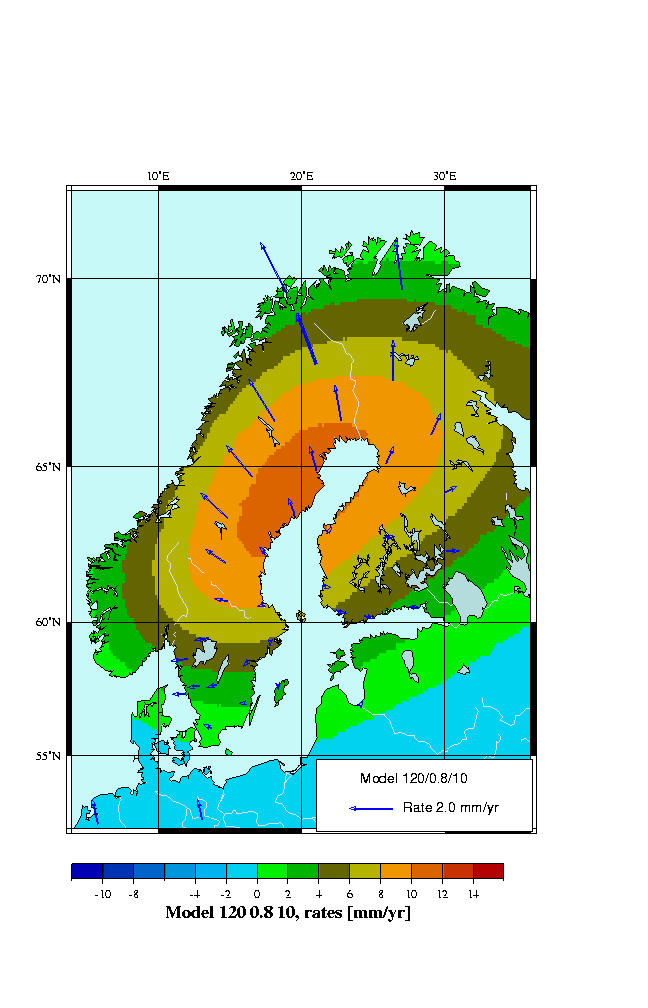
The colour graphics of the AGU/Geodynamics
article can be obtained as jpg files: Observations
& model
and Model.
Please write us if you like a reprint.
Site velocity results - Implications
We use the JPL frame issued 2000:
heflin_00_00.ssc
Site
events are given in a separate file listing the introduction of
bias
parameters for station positions.
We have selected the following stations in order to construct a
co-moving
rigid frame for Eurasian stations:
select_sites(1,0)='10402'
select_sites(2,0)='10302'
select_sites(3,0)='10503'
select_sites(4,0)='13504'
select_sites(6,0)='10317'
select_sites(5,0)='12734'
select_sites(7,0)='14201'
<Main-->>> At dome 13504M003
KOSG
EURA radial rate = -6.1598D-01 [mm/y]
<Main-->>> At dome 12734M008
MATE
EURA radial rate = -2.1568D+00 [mm/y]
<Main-->>> At dome 10503S011
METS
EURA radial rate = 2.9071D+00 [mm/y]
<Main-->>> At dome 10402M004
ONSA
EURA radial rate = 3.1044D-01 [mm/y]
<Main-->>> At dome 10302M006
TROM
EURA radial rate = 1.5539D+00 [mm/y]
<Main-->>> At dome 14201M010
WTZR
EURA radial rate = -1.2937D+00 [mm/y]
This frame moves with the following rotation wx, wy,
wz:
<AveRot>>> Average rotation:
5.3328D-10
8.8303D-11 5.7723D-10 rad/yr
<AveRot>>> Average rotation:
3.3976D+00
5.6258D-01 3.6775D+00 mm/yr
We have reduced the daily site positions with this motion before
estimating
constant rate parameters.
If you intend to fit modelled rates of motion to our
observations,
please note:
-
The horizontal part of our results can (or better: ought to) be
adjusted with a three-parameter (geocentric, rigid) rotation in
order
to allow for a residual component of plate motion.
-
The three-dimensional results can be subjected to a
six-parameter
rigid rotation and translation transformation to give allowance to
residual
motions that also include a variable offset of the reference centre
with
respect to the geocentre.
Milne et al. (2001) describe model comparisons without a 3-p
rotation
adjustment. To judge the relative rates in our Northern-European
subframe
and the greater picture of motions in the Eurasian domain you may study
and compare a recent paper by Nocquet et al. (2001).
Results.
First a link to a map
for an overview.
A more comprehensive site
map is also available
Each of the following tables lists the station name, the rate of motion
along the indicated component, the formal uncertainty of that rate, and
a factor "sigmascale" with which the rate uncertainty is to be
mulitplied
in order to yield an a-posteriori realistic measure of the uncertainty.
Rates are given in mm/yr
The tables in this document represent our standard solution.
The Edited-solution
and the EOF-solution
are available in a separate file.
New: A solution
with winter months edited away for avoiding effects of snow on
antenna.
Components:
.ra = vertical
.ea = east
.no=north
SITE co
long
lati
rate
sigma sigmascale
-----------------------------------------------------------------
ARJE.ra: 18.1249
66.3180
8.32
0.22
2.45
BORA.ra: 12.8913
57.7150
2.92
0.21
1.50
BRUS.ra: 4.3592
50.7978
-1.77
0.18
1.80
HASS.ra: 13.7181
56.0922
0.99
0.21
1.90
HERS.ra: 0.3363
50.8673
-1.15
0.09
22.76
JOEN.ra: 30.0962
62.3912
5.06
0.17
2.48
JONK.ra: 14.0596
57.7455
3.60
0.21
1.93
KARL.ra: 13.5056
59.4440
5.90
0.21
1.91
KEVO.ra: 27.0071
69.7559
4.92
0.26
4.79
KIRU.ra: 21.0602
67.8776
8.71
0.23
3.66
KIVE.ra: 25.7023
62.8199
8.14
0.26
2.98
KOSG.ra: 5.8096
52.1784
-0.84
0.09
1.35
KUUS.ra: 29.0335
65.9102
11.80
0.27
5.65
LEKS.ra: 14.8770
60.7221
8.23
0.44
2.37
LOVO.ra: 17.8289
59.3378
5.92
0.21
1.46
MADR.ra: -4.2497
40.4292
1.33
0.26
1.87
MART.ra: 17.2585
60.5951
7.14
0.21
1.86
METS.ra: 24.3953
60.2175
5.42
0.24
1.36
NORR.ra: 16.2464
58.5902
4.92
0.21
1.38
NYAL.ra: 11.8651
78.9296
5.43
0.19
1.46
OLKI.ra: 21.4727
61.2397
8.42
0.18
1.77
ONSA.ra: 11.9255
57.3953
-0.26
0.36
1.13
OSKA.ra: 15.9968
57.0656
2.13
0.21
2.27
OSTE.ra: 14.8581
63.4428
8.54
0.21
2.45
OULU.ra: 25.8928
65.0862
11.07
0.21
3.29
OVER.ra: 22.7734
66.3179
9.17
0.23
2.01
POTS.ra: 13.0661
52.3793
-1.48
0.18
1.52
RIGA.ra: 24.0588
56.9486
2.26
0.24
4.19
ROMU.ra: 29.9315
64.2170
7.17
0.28
2.34
SAAR.ra: 20.9684
67.8574
7.92
0.14
3.31
SKEL.ra: 21.0483
64.8792
10.68
0.22
2.00
SODA.ra: 26.3890
67.4209
9.77
0.23
4.13
SUND.ra: 17.6599
62.2325
9.92
0.21
1.69
SVEG.ra: 14.7000
62.0174
8.38
0.20
2.61
TROM.ra: 18.9383
69.6628
3.76
0.28
1.45
TUOR.ra: 22.4434
60.4158
6.32
0.17
1.52
UMEA.ra: 19.5096
63.5781
11.06
0.21
1.81
VAAS.ra: 21.7706
62.9612
10.69
0.20
2.54
VANE.ra: 12.0350
58.6931
4.25
0.21
1.61
VILH.ra: 16.5599
64.6978
8.80
0.21
4.32
VIRO.ra: 27.5550
60.5388
2.97
0.18
2.51
VISB.ra: 18.3673
57.6539
2.85
0.20
1.77
WETB.ra: 12.8789
49.1442
0.80
0.36
1.14
WETT.ra: 12.8789
49.1442
-0.18
0.21
1.07
WTZR.ra: 12.8789
49.1442
-0.19
0.22
1.13
ARJE.ea: 18.1249
66.3180
-1.02
0.08
2.24
BORA.ea: 12.8913
57.7150
-1.26
0.07
1.74
BRUS.ea: 4.3592
50.7978
-0.48
0.08
2.15
HASS.ea: 13.7181
56.0922
-0.90
0.08
1.78
HERS.ea: 0.3363
50.8673
1.09
0.04
4.35
JOEN.ea: 30.0962
62.3912
0.29
0.06
2.73
JONK.ea: 14.0596
57.7455
-0.58
0.08
1.69
KARL.ea: 13.5056
59.4440
-0.99
0.08
1.78
KEVO.ea: 27.0071
69.7559
0.03
0.08
3.17
KIRU.ea: 21.0602
67.8776
-0.83
0.08
3.38
KIVE.ea: 25.7023
62.8199
1.16
0.10
2.38
KOSG.ea: 5.8096
52.1784
-0.36
0.04
1.75
KUUS.ea: 29.0335
65.9102
2.59
0.10
3.97
LEKS.ea: 14.8770
60.7221
-0.36
0.16
1.91
LOVO.ea: 17.8289
59.3378
0.04
0.08
1.65
MADR.ea: -4.2497
40.4292
-0.92
0.13
1.77
MART.ea: 17.2585
60.5951
-0.21
0.07
1.81
METS.ea: 24.3953
60.2175
0.55
0.04
1.91
NORR.ea: 16.2464
58.5902
-0.24
0.08
1.69
NYAL.ea: 11.8651
78.9296
-0.66
0.07
1.62
OLKI.ea: 21.4727
61.2397
0.62
0.07
2.00
ONSA.ea: 11.9255
57.3953
-1.45
0.14
1.44
OSKA.ea: 15.9968
57.0656
-0.64
0.08
1.83
OSTE.ea: 14.8581
63.4428
-1.11
0.08
1.92
OULU.ea: 25.8928
65.0862
1.01
0.08
2.96
OVER.ea: 22.7734
66.3179
0.38
0.08
2.99
POTS.ea: 13.0661
52.3793
-0.26
0.08
2.92
RIGA.ea: 24.0588
56.9486
0.42
0.10
2.02
ROMU.ea: 29.9315
64.2170
1.58
0.10
2.62
SAAR.ea: 20.9684
67.8574
-1.18
0.05
3.83
SKEL.ea: 21.0483
64.8792
0.04
0.08
2.32
SODA.ea: 26.3890
67.4209
0.01
0.08
6.12
SUND.ea: 17.6599
62.2325
-0.20
0.08
1.90
SVEG.ea: 14.7000
62.0174
-1.31
0.08
1.75
TROM.ea: 18.9383
69.6628
-1.47
0.09
2.00
TUOR.ea: 22.4434
60.4158
0.61
0.06
2.18
UMEA.ea: 19.5096
63.5781
-0.35
0.08
1.93
VAAS.ea: 21.7706
62.9612
0.16
0.07
2.39
VANE.ea: 12.0350
58.6931
-1.04
0.08
1.68
VILH.ea: 16.5599
64.6978
-1.01
0.08
2.15
VIRO.ea: 27.5550
60.5388
0.45
0.07
2.42
VISB.ea: 18.3673
57.6539
-0.11
0.08
1.72
WETB.ea: 12.8789
49.1442
0.70
0.14
1.40
WETT.ea: 12.8789
49.1442
0.18
0.09
3.74
WTZR.ea: 12.8789
49.1442
0.07
0.09
4.45
ARJE.no: 18.1249
66.3180
0.91
0.06
3.33
BORA.no: 12.8913
57.7150
-0.24
0.04
2.07
BRUS.no: 4.3592
50.7978
-1.31
0.04
2.27
HASS.no: 13.7181
56.0922
-0.04
0.05
2.10
HERS.no: 0.3363
50.8673
0.69
0.02
13.20
JOEN.no: 30.0962
62.3912
-0.45
0.04
3.12
JONK.no: 14.0596
57.7455
-0.16
0.05
2.06
KARL.no: 13.5056
59.4440
-0.37
0.05
2.17
KEVO.no: 27.0071
69.7559
1.28
0.06
4.15
KIRU.no: 21.0602
67.8776
1.07
0.06
3.85
KIVE.no: 25.7023
62.8199
-0.28
0.06
2.96
KOSG.no: 5.8096
52.1784
0.04
0.02
1.90
KUUS.no: 29.0335
65.9102
0.14
0.07
4.19
LEKS.no: 14.8770
60.7221
-0.20
0.09
2.29
LOVO.no: 17.8289
59.3378
-0.85
0.05
1.93
MADR.no: -4.2497
40.4292
0.09
0.06
2.41
MART.no: 17.2585
60.5951
-0.51
0.05
2.15
METS.no: 24.3953
60.2175
-0.44
0.02
2.66
NORR.no: 16.2464
58.5902
-0.48
0.05
2.04
NYAL.no: 11.8651
78.9296
0.15
0.05
2.15
OLKI.no: 21.4727
61.2397
-0.54
0.04
2.33
ONSA.no: 11.9255
57.3953
-0.23
0.08
1.78
OSKA.no: 15.9968
57.0656
-0.20
0.05
2.89
OSTE.no: 14.8581
63.4428
0.45
0.05
2.64
OULU.no: 25.8928
65.0862
0.60
0.05
3.32
OVER.no: 22.7734
66.3179
0.90
0.06
3.99
POTS.no: 13.0661
52.3793
0.15
0.04
2.02
RIGA.no: 24.0588
56.9486
-0.14
0.06
3.16
ROMU.no: 29.9315
64.2170
-0.09
0.07
3.21
SAAR.no: 20.9684
67.8574
0.69
0.03
8.51
SKEL.no: 21.0483
64.8792
0.38
0.05
3.15
SODA.no: 26.3890
67.4209
1.11
0.06
4.43
SUND.no: 17.6599
62.2325
-0.33
0.05
2.45
SVEG.no: 14.7000
62.0174
0.26
0.05
2.25
TROM.no: 18.9383
69.6628
1.97
0.06
3.88
TUOR.no: 22.4434
60.4158
-0.49
0.04
2.86
UMEA.no: 19.5096
63.5781
-0.23
0.05
2.93
VAAS.no: 21.7706
62.9612
-0.54
0.05
2.61
VANE.no: 12.0350
58.6931
0.06
0.05
2.10
VILH.no: 16.5599
64.6978
0.56
0.05
3.50
VIRO.no: 27.5550
60.5388
-0.40
0.05
3.40
VISB.no: 18.3673
57.6539
-0.54
0.05
2.15
WETB.no: 12.8789
49.1442
-0.24
0.07
2.06
WETT.no: 12.8789
49.1442
0.16
0.05
2.14
WTZR.no: 12.8789
49.1442
-0.03
0.05
2.36
Comments:
Results for TROM include both TROM and TRO1 observations
Results for NYAL include both NYAL and NYA1 observations
Results for WETT include both WETB and WTZR observations
Reference:
Nocquet, J.-M. ; Calais, E. ; Altamimi, Z. ; Sillard,
P.
; Boucher, C. 2001
Intraplate deformation in western Europe deduced from
an analysis of the International Terrestrial Reference Frame
1997 (ITRF97) velocity field
J. Geophys. Res. Vol. 106 , No. B6 , p. 11,239
(2000JB900410)
.bye