Do maneuvers with the 20m radio telescope affect the gravimeter?
The 20m radio telescope consists of a parabolical dish and a
counterweight. Depending upon whether the gravimeter "sees" this
arrangement head-on or from the side, the gravity attraction
is maximum or minimum in these two respective extremes.
The mass distribution in the telescope can be approximated by a 2×45 ton dipole that
rotates according to the pointing commands. These are frequent and
may imply large slews especially during Geo-VLBI experiments.
The gravity attraction of the mass dipole is given by

where H, Hs,, and As is the height and
northing of the antenna and the gravimeter, respectively, A and α the antenna pointing azimuth and altitude, M the total mobile masses
seperated by distance d = 5
m, D = 80 m the distance
between antenna and gravimeter, and G is the constant of gravity. The height
difference is 10 m.
From Geo-VLBI schedules
----------------------------------------------------------
Exp. name Year Day UT start
Year Day UT stop
----------------------------------------------------------
cl09sx1
2009
174 08:57:12 2009 216
08:48:43
eg040fon
2009
166 08:28:40 2009 166
22:30:27
ey008aon
2009
217 06:44:31 2009 218
08:06:25
f09m1on
2009
303 07:23:26 2009 303
10:50:46
r1385on
2009
180 16:30:09 2009 181
17:04:10
r1386on
2009
187 12:11:00 2009 188
17:06:23
rd0908on
2009
266 14:13:04 2009 267
17:57:06
rg001con
2009
184 11:36:36 2009 185
17:01:26
tl09c6
2009
230 12:04:50 2009 295
11:25:37
tl09x1on
2009
216 09:32:57 2009 217
07:46:34
-----------------------------------------------------------------------------
we have extracted time series of pointing to radio sources, right
ascension and declination, and transformed the angles to the
horizontal system.
The gravimeter record was reduced from tides and atmospheric
effects, was band-pass filtered (Fig.1), downsampled to 30 s
intervals, and chopped to retain sections synchronous with the VLBI
schedules (Fig.2)
A least-squares fit of the variable factors in Eq. 1 gave the
following results:
RESULTS: ADMITTANCES, LOCAL
COPHASES
SITE/FILE: gdrc.ts lon/lat:
11.9260 57.3964
Normalized Chi^2 of fit : 4.57D-04, R=
2.14D-02 , X_1 X_2 = 1.00 2.30, Nev= 4
The error information
below is compatible with a unit normalized Chi^2.
<rslist>d>
rmsu= 2.138407516121582E-002 weff=
1.00000000000000 rchi= 1.00064262960750
SYMB #b Regression signal
Admittance
parameter +- 68.3% cfd
PSIN 1
<gdrc4pointing.mc>
-0.000396
+-0.000343
PCOS 2
<gdrc4pointing.mc>
0.001146
+-0.000357
/
3 Linear
[uGal]/(12717*8.33333D-03[h])
0.000058
+-0.000671
/
3 Linear
[uGal]/[year]
0.004822
+-0.055471
-W 4
Const
1.000D+00
-0.000003
+-0.000191
Remarkably,
1/2
arctan( PSIN/PCOS coefficients ), 1/2 arctan(-396/1146) = -9o, is not far
away from the bearing of the gravity station from the telescope
(-17o, Fig.3). However,
the
uncertainty of this angle is ±35o, so the determination
cannot be called sharp.
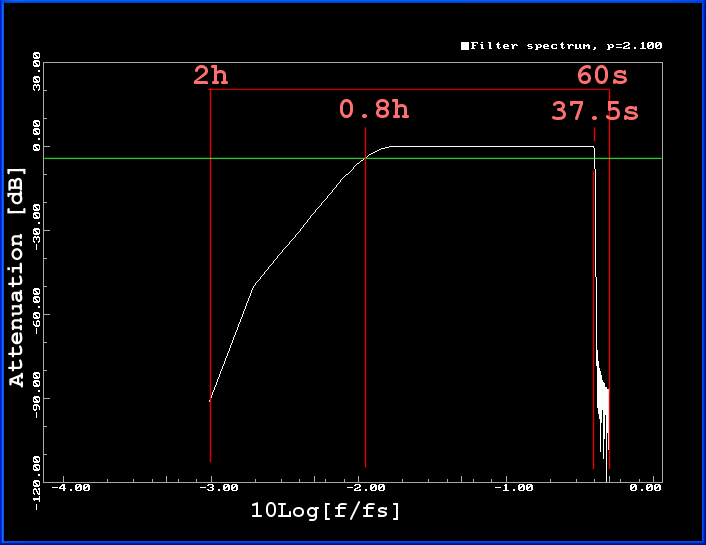
Fig. 1 - Band-pass filter for suppressing drift and microseisms. The
filter was applied on both the pointing and the
gravity time-series before the least squares fit. The sample
frequency, 1/30 Hz, is denoted by fs
(1/30 Hz in the experiment).
The band-pass filter is of window-design type. The pass-band is
Fourier-integrated in the frequency domain, and the time series is
windowed using a Kaiser-Bessel window with design parameter 2.1
(Harris, 1982) and a taper length of ± 60.
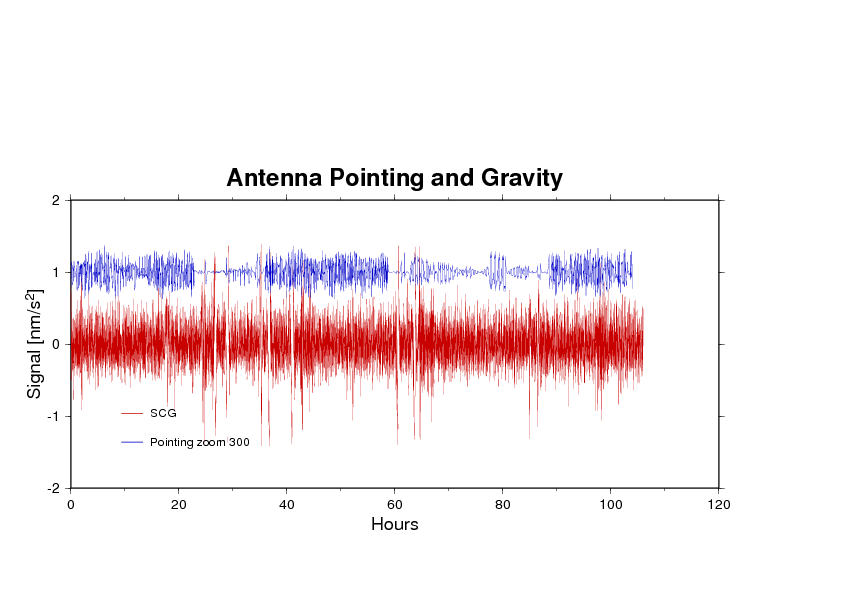
Fig 2.a -The whole range of pointing and gravity time series. The
ordinate units are really uGal - sorry. The best-fitting amplitude
of the pointing time-series has been increased with a factor 300.
Figure 2b shows a short sub-interval
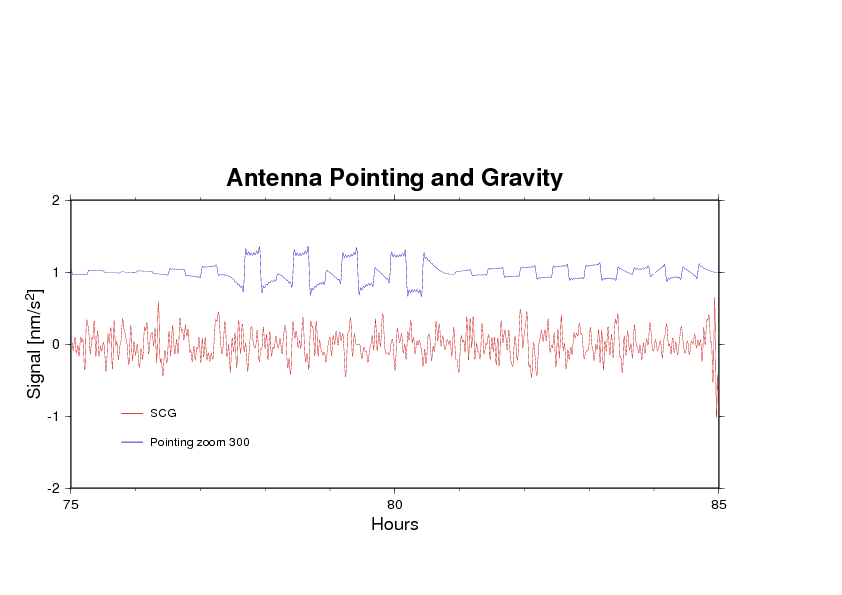
Fig.2b - suggesting that there are more important noises than
antenna pointing effects. This serie was filtered more narrow than
specified in the text. The actual filter had an upper corner
frequency of 0.2 fs, half
of the one used in Figure 2a.
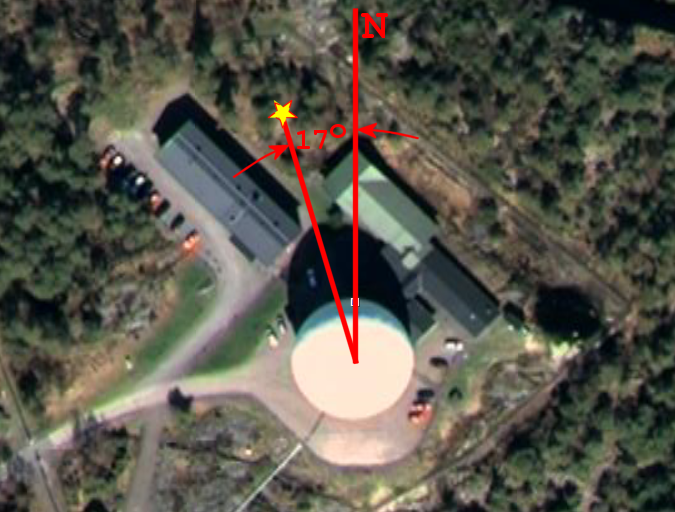
Fig 3 - The bearing angle of the gravity station as seen from the
20m radio telescope. This aerial photo (GoogleEarth) is too old to
show the building of the gravity lab.