The earth's hum - or an average over all earthquakes since July
2009 and up to Dec. 8, 2012.
A periodogram has been stacked together from all days since July
2009. Input was 1-second data from each individual day, reduced for
tides and atmospheric pressure. There is not much coherent power
over the time span in the observations; however, the spectrum
estimate attenuates the noise due to the heavy stacking. By adding
decibel units, we effectively obtain the harmonic mean, which helps
a little to amplify peaks with respect to troughs.
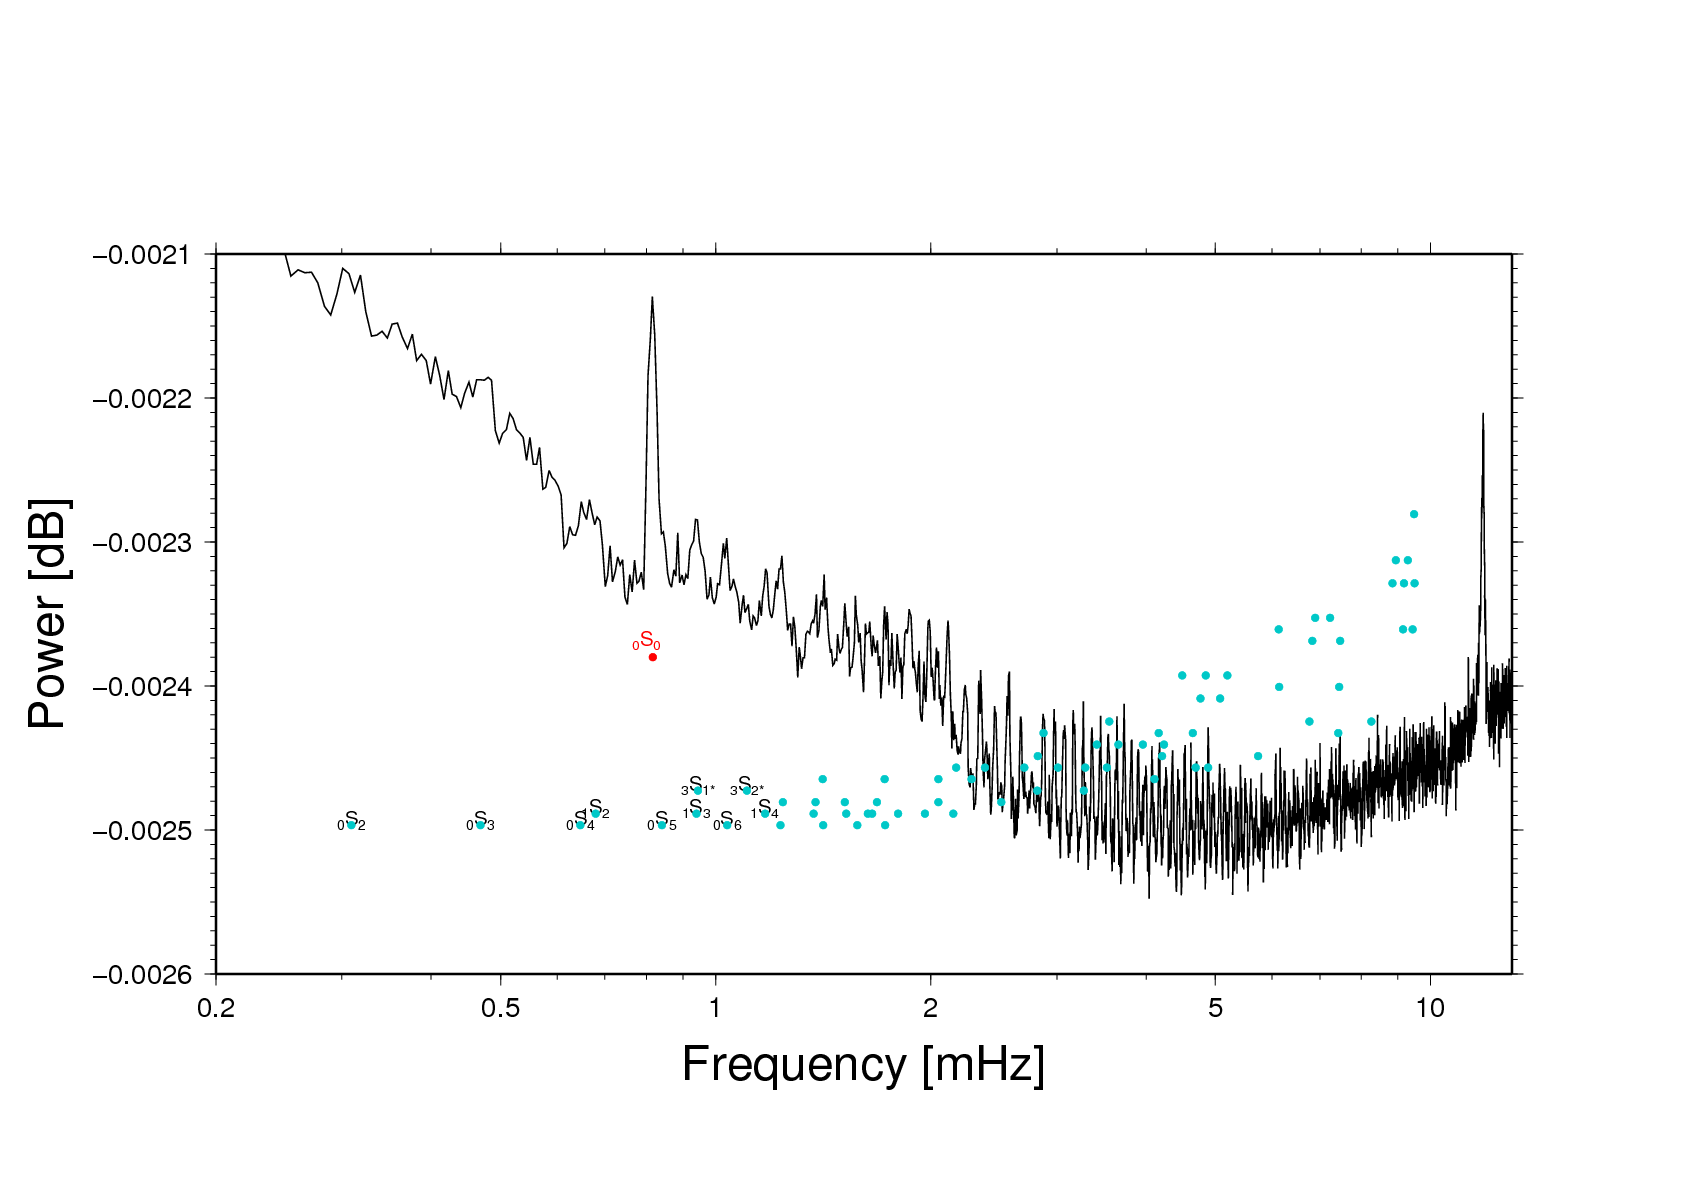
Notice the strong 0S0 mode ("breething" or
"balloon" mode). The peak near 12 mHz originates in the oscillation
of the sensor ball inside the instrument.
What could be made better in the preparation of this diagram? For
one thing, notice that we've used a rectangular window. The power
increase towards low frequencies is maybe contaminated by DC or
almost DC signal leaking through the window sidelobes. Thus: stack a
2-day long record every day, use a Hanning window, and do it all
over again.