The Free-Oscillation band during the last 30 days
Click on respective image to view it in original size.
Want to see older spectrograms? Explore subdirectories for the years
2025 | 2024 | 2023 | 2022 | 2021
| 2020
| 2019
| 2018
| 2017
| 2016
| 2015
starting in June.
URL model: http://holt.oso.chalmers.se/hgs/SCG/PNG/<year>/<month>/<day>-last-30-days.f<C>.png
where <C> is a mark for the frequency range; in earlier
years o or w ,
in later years m or n
e.g. http://holt.oso.chalmers.se/hgs/SCG/PNG/2015/06/01-last-30-days.fo.png
For 2020, spectrograms are missing for Jan 1 to July 12.
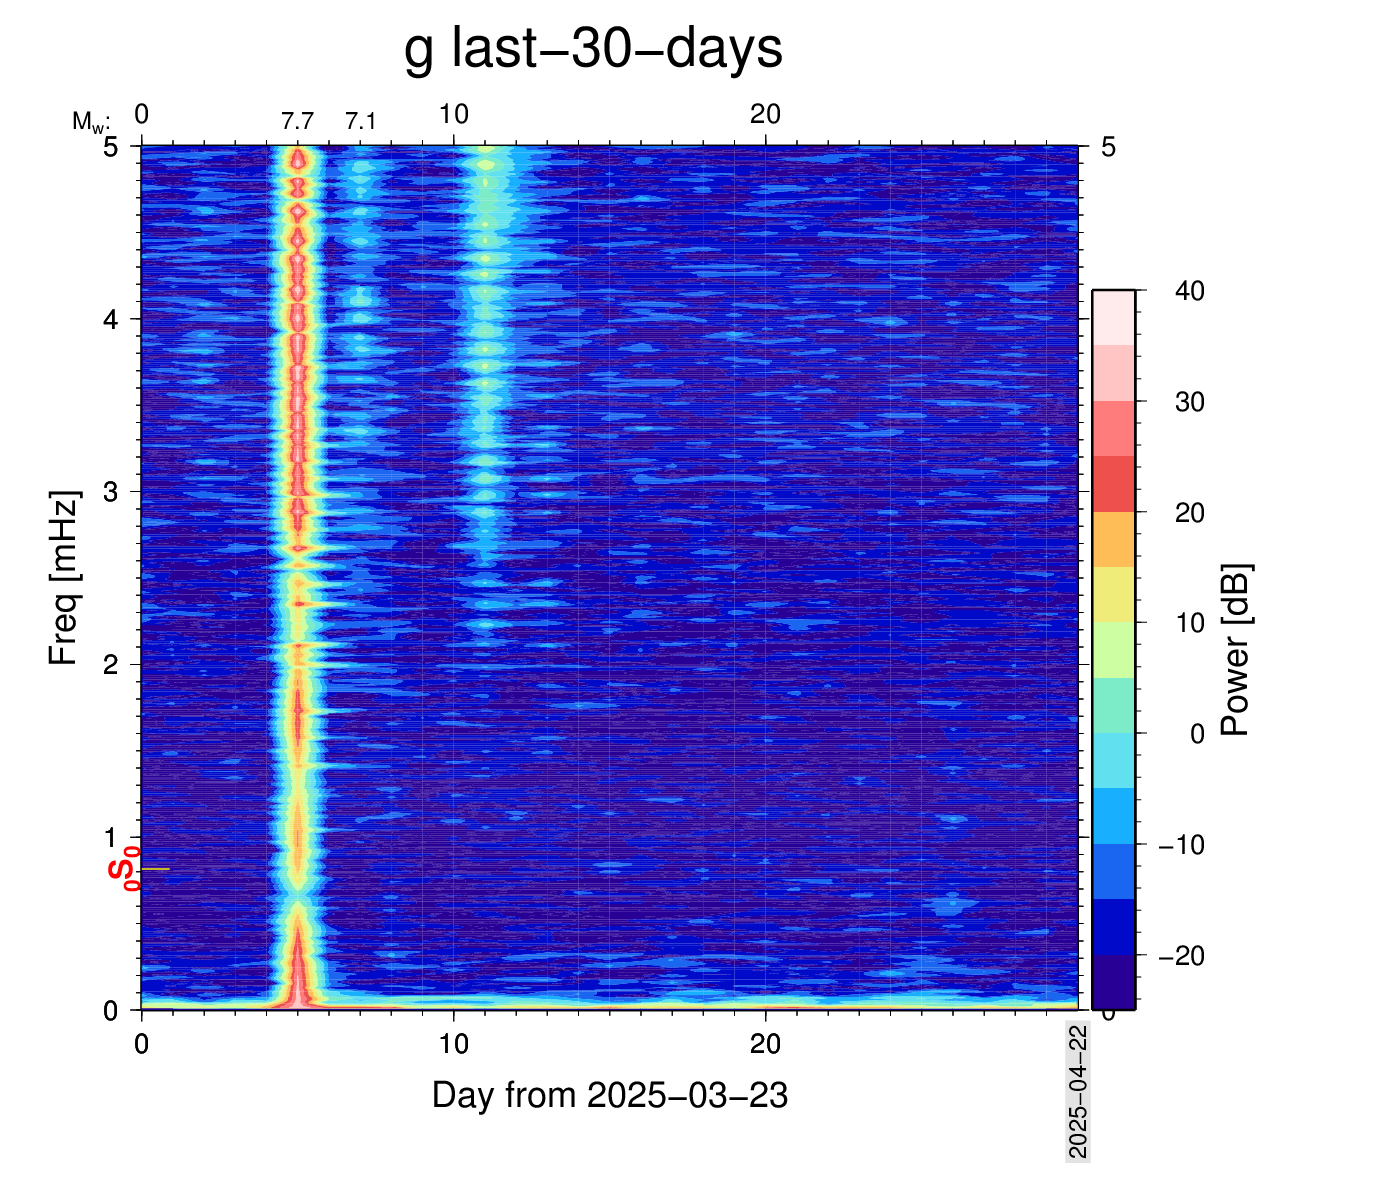
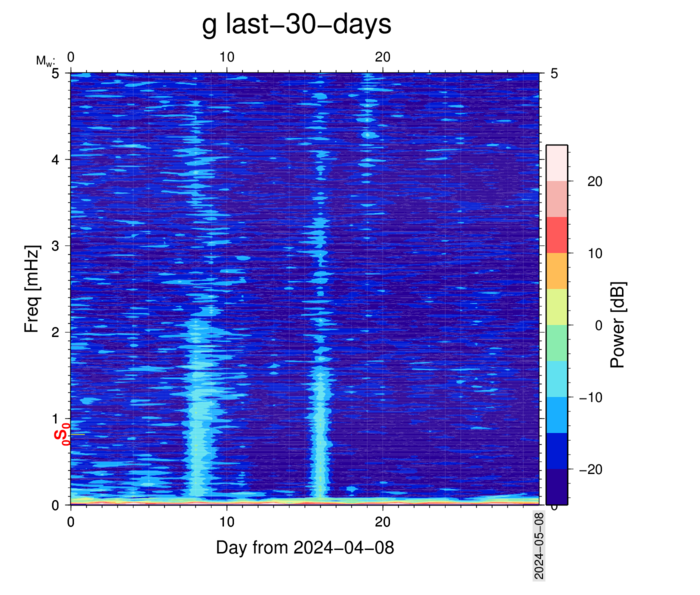
0 - 5 mHz
|
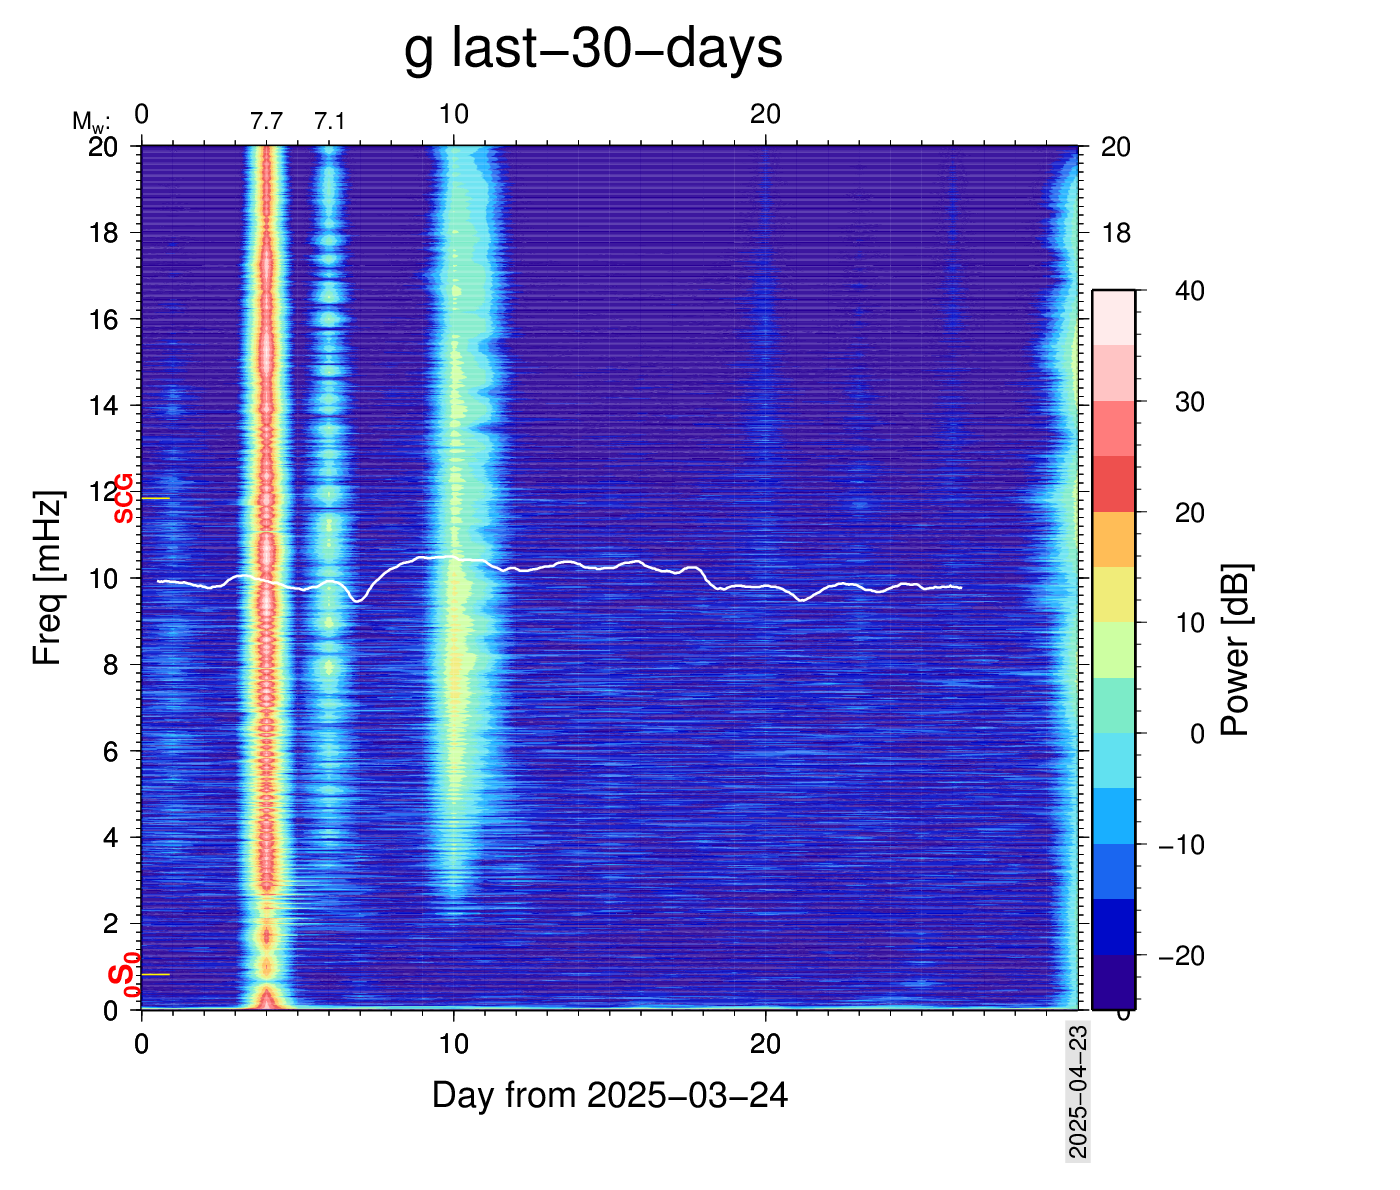
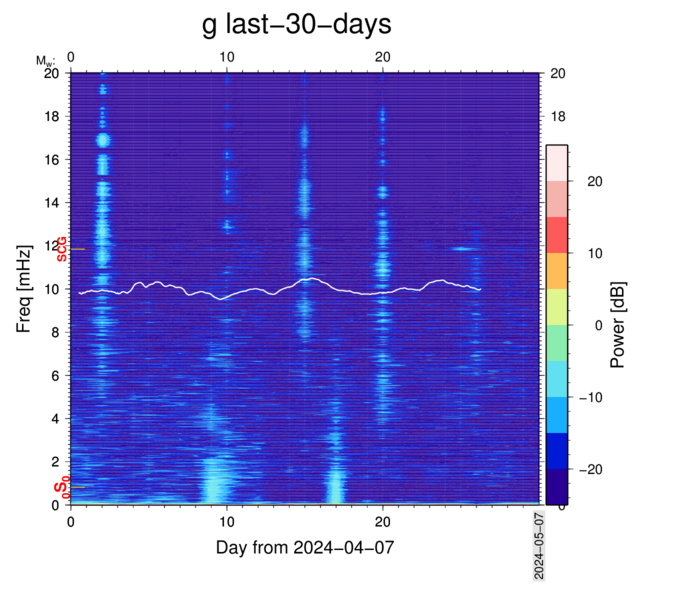
0 - 20 mHz |
|
|
The white curve shows air pressure (not drawn to any scale). You
might notice covariation with the frequency
of the almost ever persistent oscillation near 2 mHz, which we
believe originates in the Heater Current control loop.
The OSG 054 seems to be a rare case where this current has a
noticeable effect on the gravity sensor.