Hans in stormy weather
(the Onsala superconducting gravimeter has Hans as a nickname)
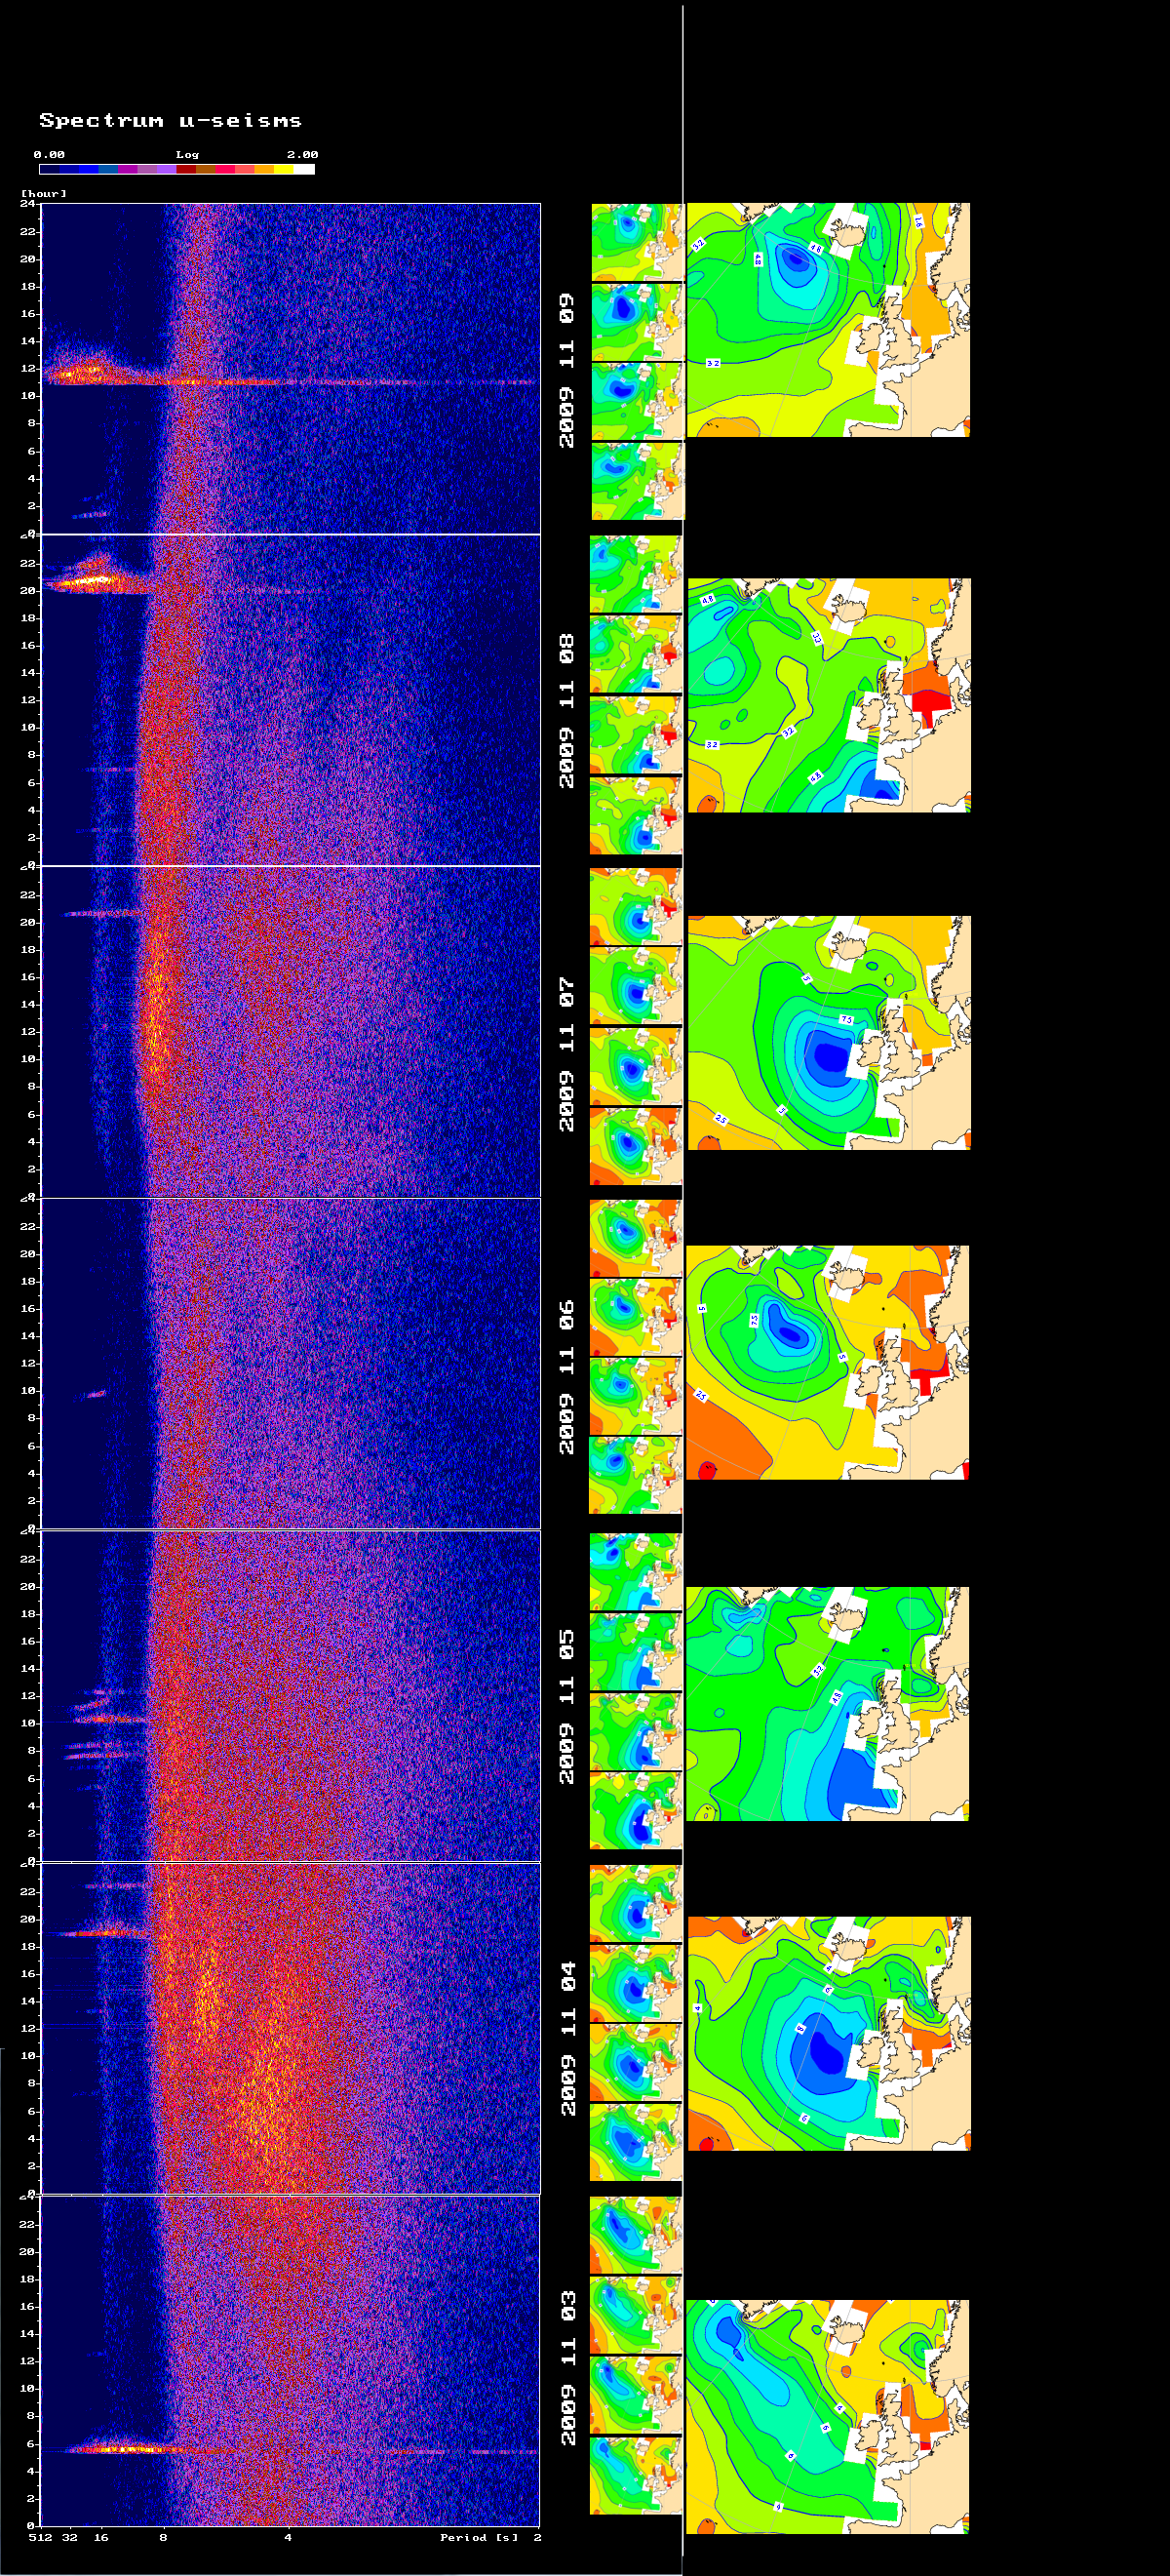
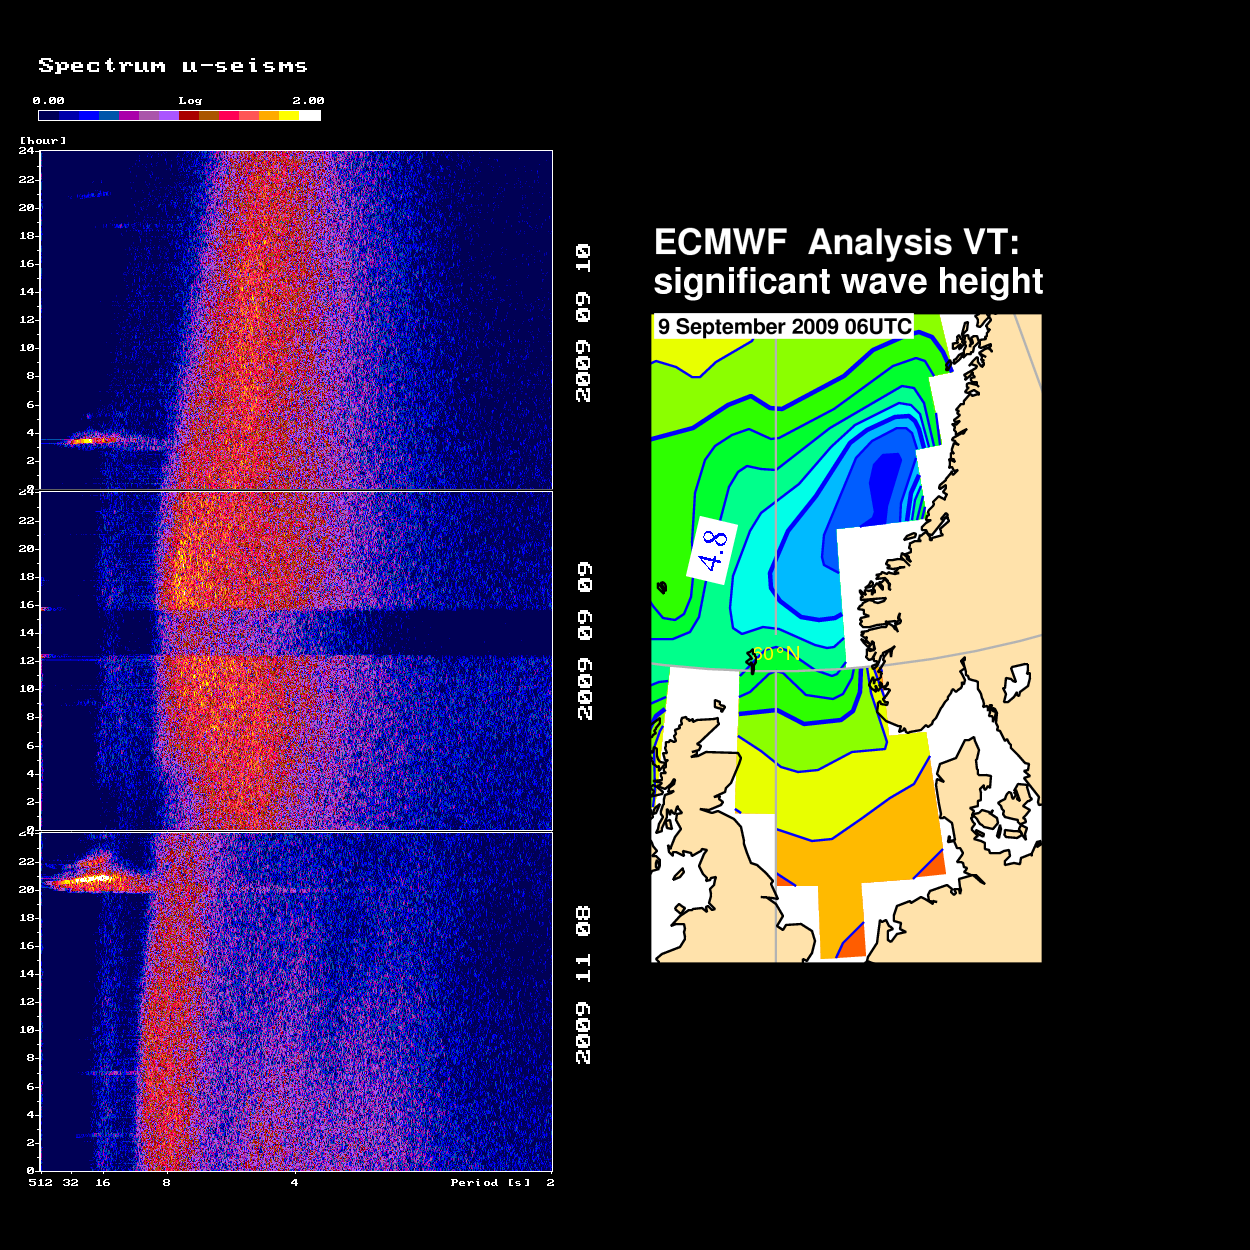
Two examples: A storm in the Norwegian Sea Sep. 08-10, 2009, and a
storm sequence on the North Atlantic first week in November, 2009.
We show: a running spectrum of microseims between 512 and 2 seconds
period to the left. To the right you see Significant Waveheight (ECMFW
Wavemodel Analysis), blue indicating high waves.
During the period of the first days in November 2009 (3 to 9) storms
were particularly active in the North Atlantic, patterns repeating as
the wave height region moves from south of Greenland into the Bay of
Biscaya. The microseimic level rises when the wavefield hits the shelf
west or southwest of Ireland. The small charts show the wavefields at
the synoptic times UT 0:00 6:00 12:00 and 18:00 each day, the
larger-size charts the situation at noon each day, except at 0:00 on
the first and at 18:00 on the last day. The storm-generated microseisms
seem to go up in peak frequency when the waves progress into shallower
water.
(Eventual stripes with spectral energy concentrated around 20 s are due
to earthquakes).
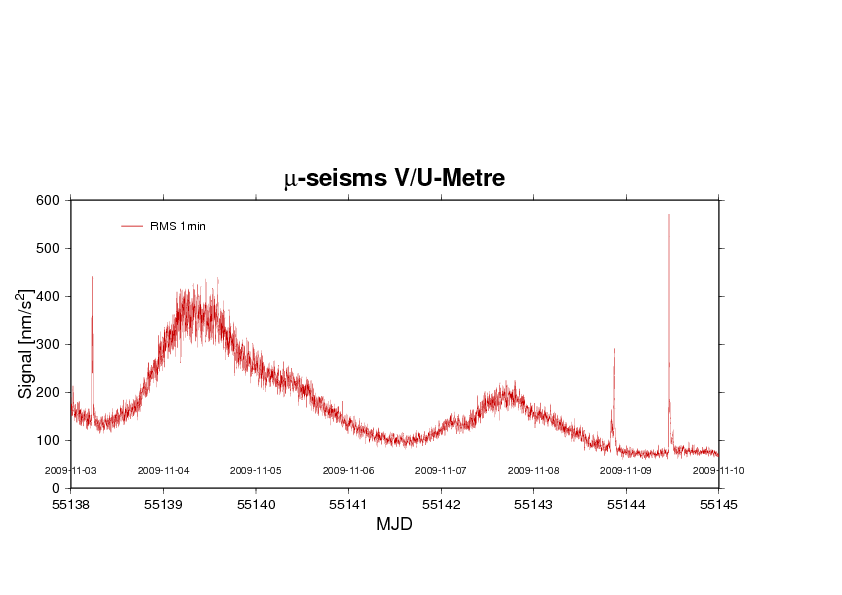
This diagram shows the signal RMS (tides and barometric effects
subtracted and short-period signal enhanced with a simple difference
filter)
Norwegian Sea 2009-09-08 -- 10
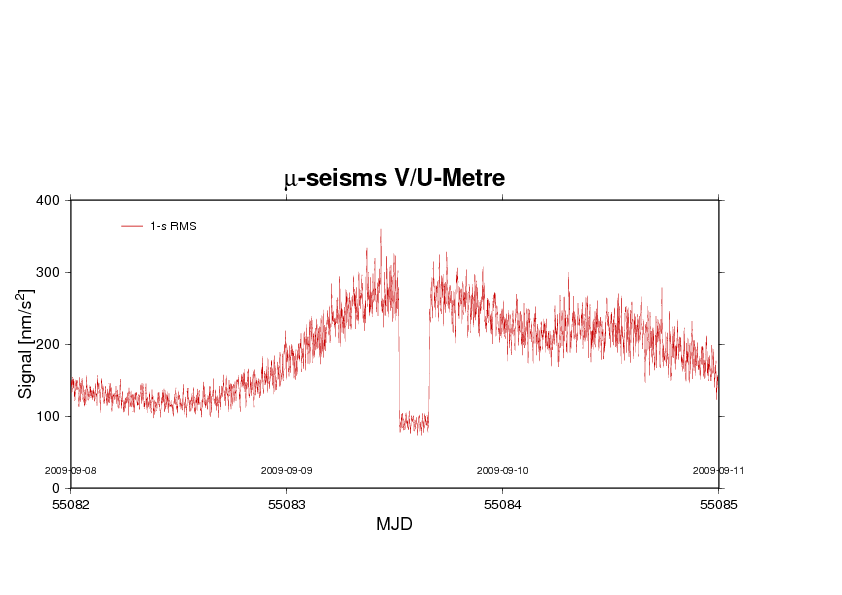
The dip around noon Sep. 9: This was "my first storm", so before
identifying the reason for the large increase of the noise I suspected
malfunction of the gravimeter. During a few hours I turned he feedback
amplification down, which caused a more sluggish response, attenuating
the high