News from GWR 054, the Superconducting Gravimeter at Onsala Space
Observatory
2009 OCT 06
After the earthquakes of Samoa and Padang/Sumatra Sep 29-30.
We show four images.Click on the blue-framed diagrams (Fig. 1 and 2) to
obtain larger-scale figures.
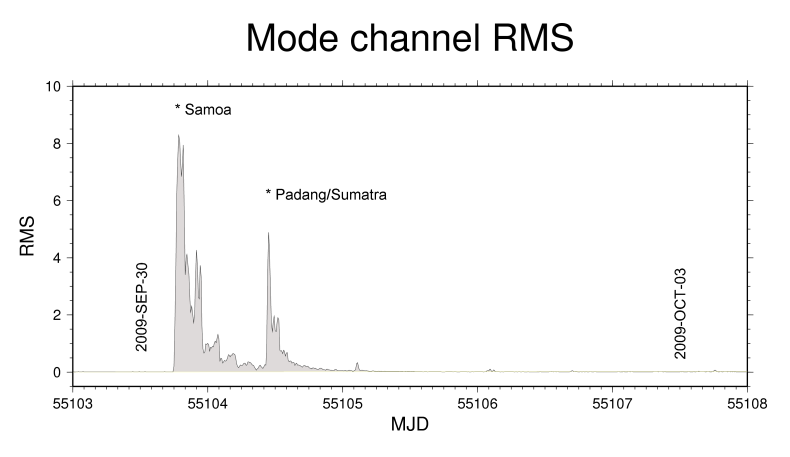
Figure 1 - Sliding-window RMS (a kind of UV-meter like the one on
your audio amp at home) showing how the coda of the Samoa earthquake is
intercepted by the strike at Padang. Both events caused
free-oscillations, the "ringing bell of the earth". The mode channel
was used (a bandpass filtered acceleration signal) at 1 min sampling
rate.

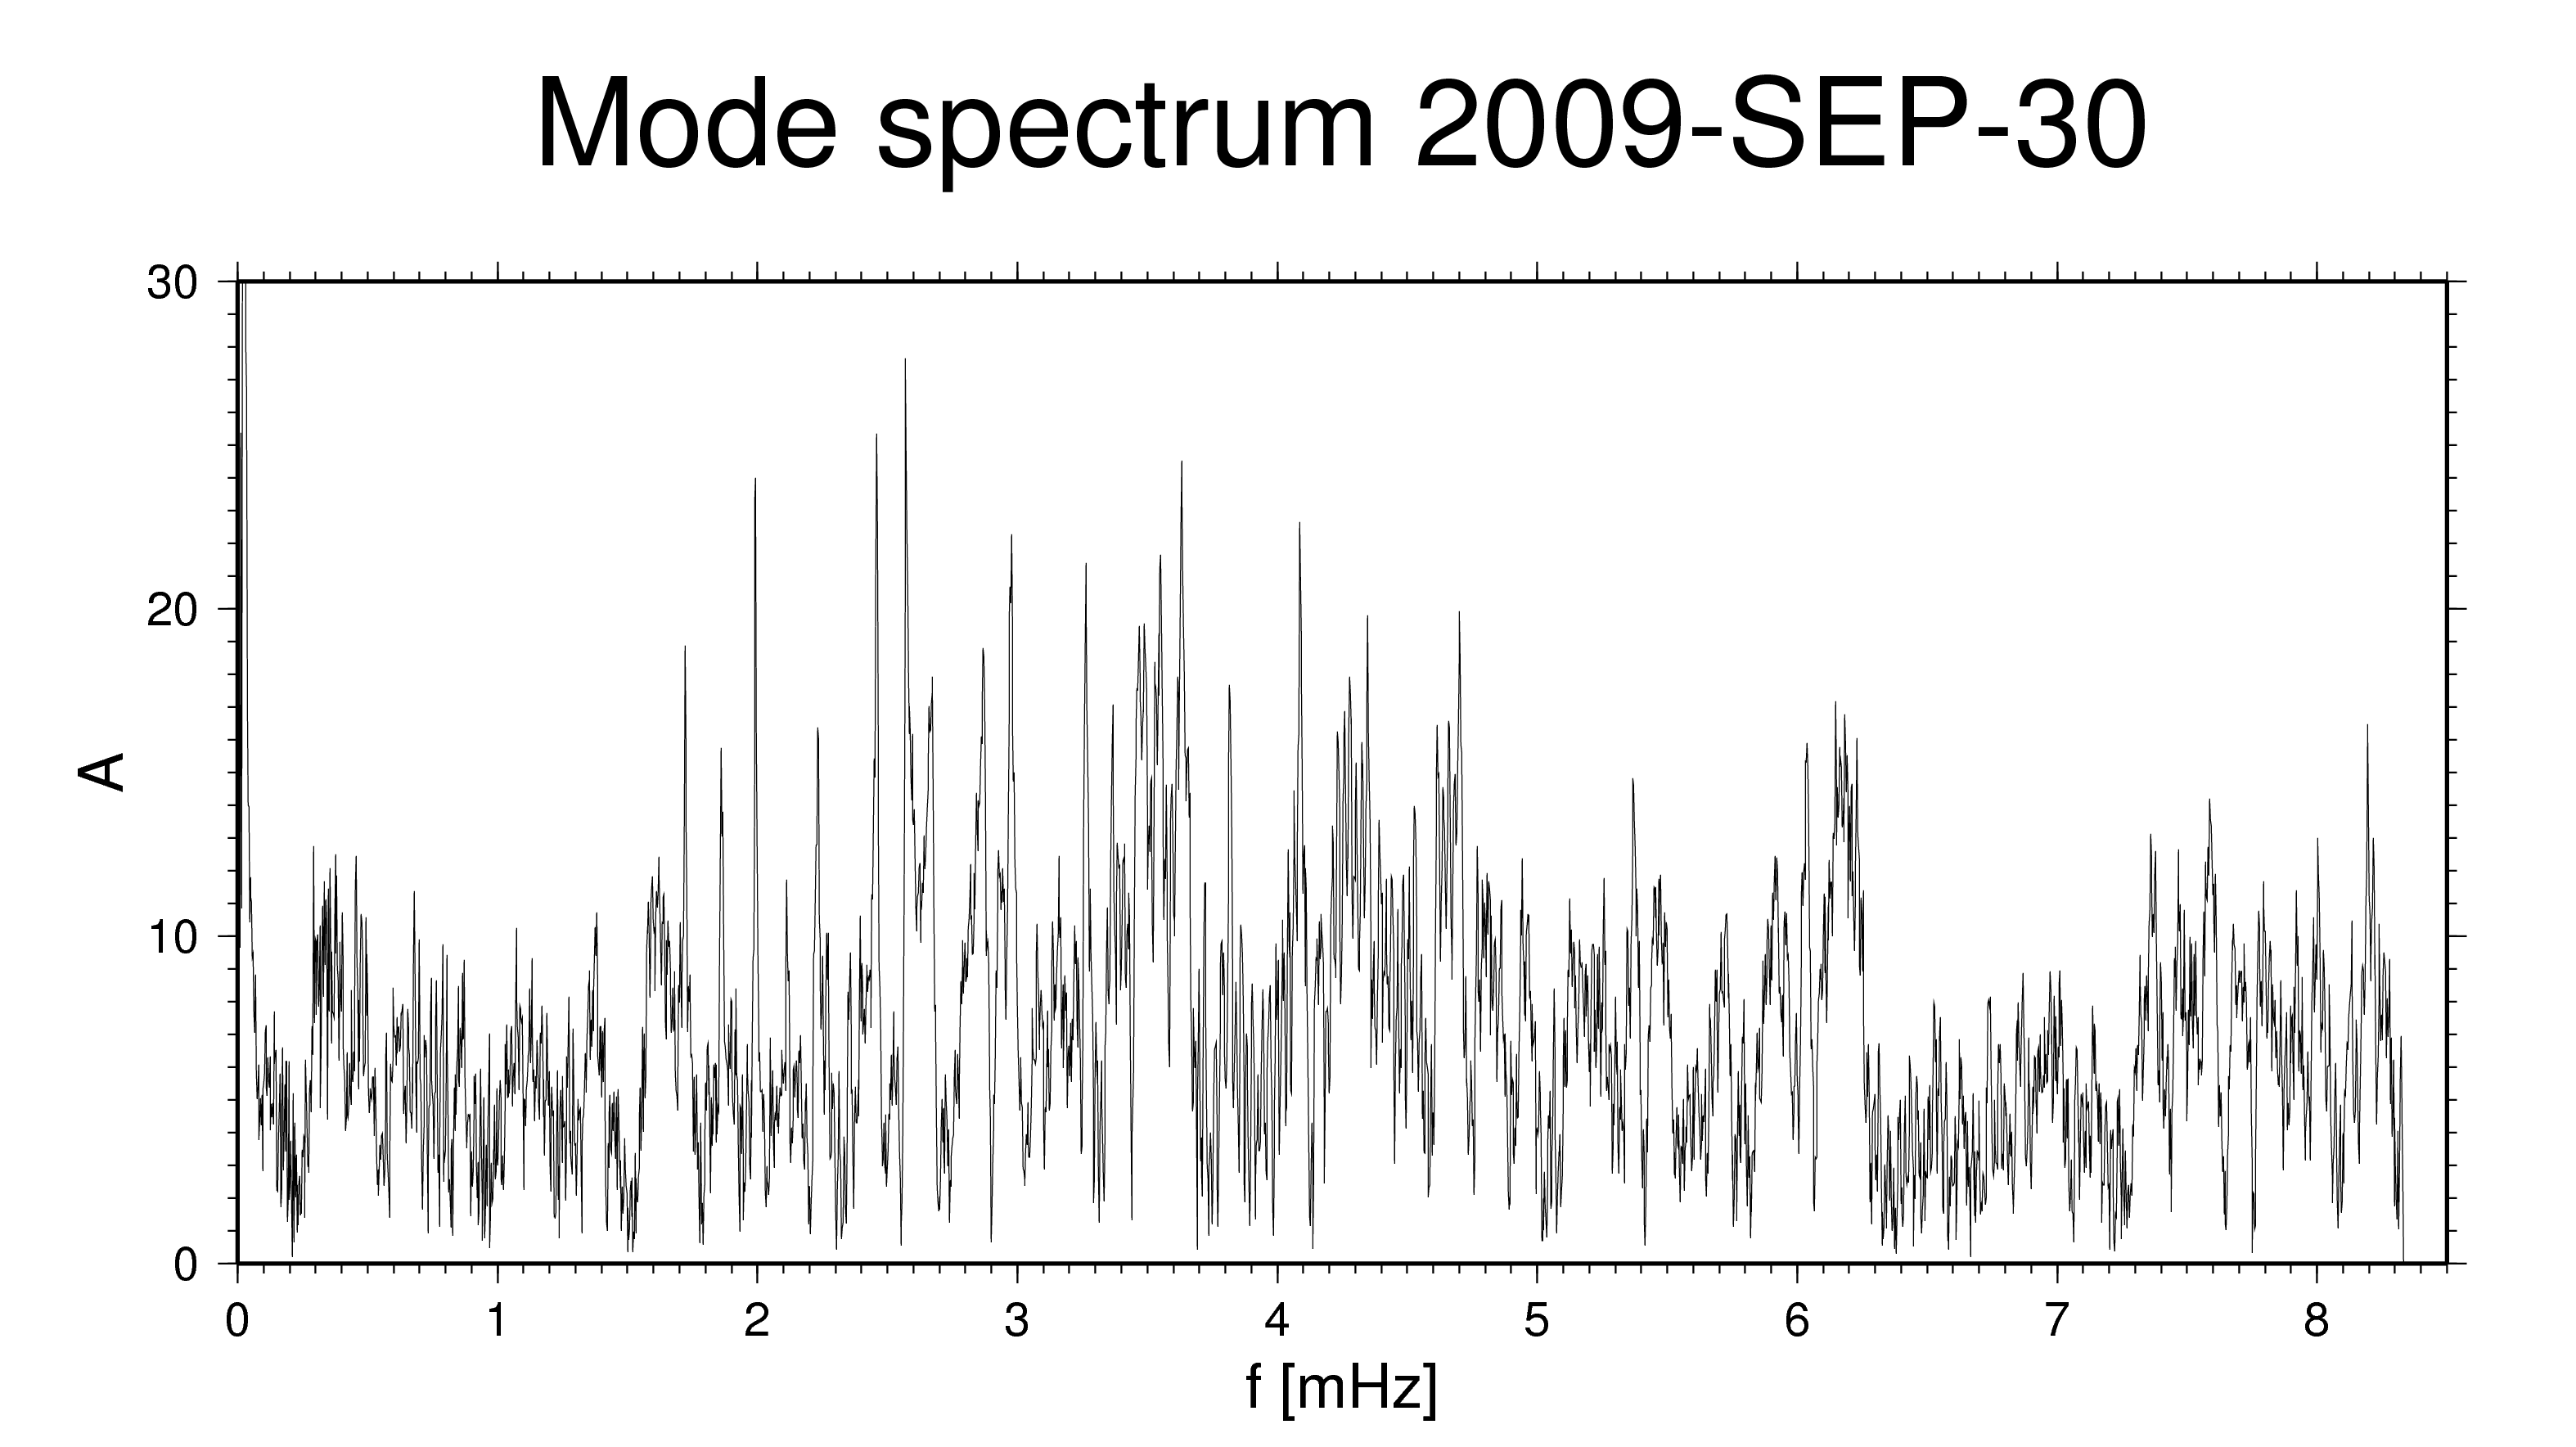
Figure 2 - Periodogram from a mode-channel data segment starting Sep
30, 13:00 UT and ending Oct. 4 (incl), i.e. including only the Sumatra
event.
Possible improvements for this figure: Reduction for air pressure. (Don't
think there's much to be gained though)
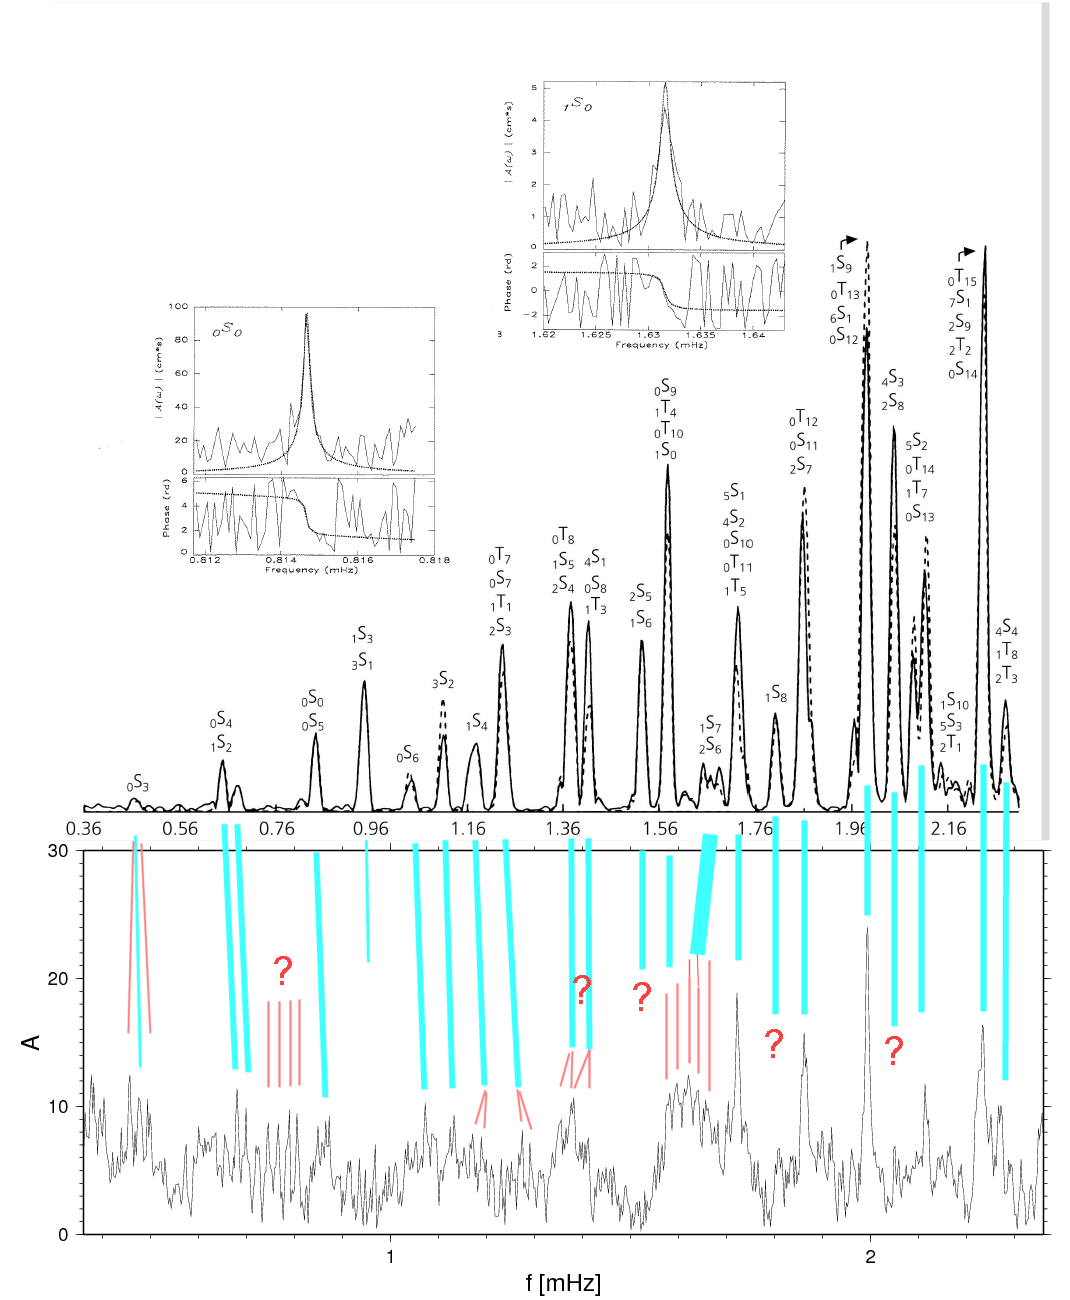
Figure 3: An attempt to identify low-frequency normal-modes. The frame
in the bottom is the lower part of the spectrum of Fig. 2. The upper
part is a spectrum from the earthquake of Bolivia, June 9, 1994. The
two zoom-ups of 0S0 and 1S0
are from E.A. Okal, GRL 23:5, 431-434, 1996. The question is, whether
the mode splitting indicated by the read lines is realistic. Observe
that the gravimeter is largely insensitive to the toroidal modes (sTn).
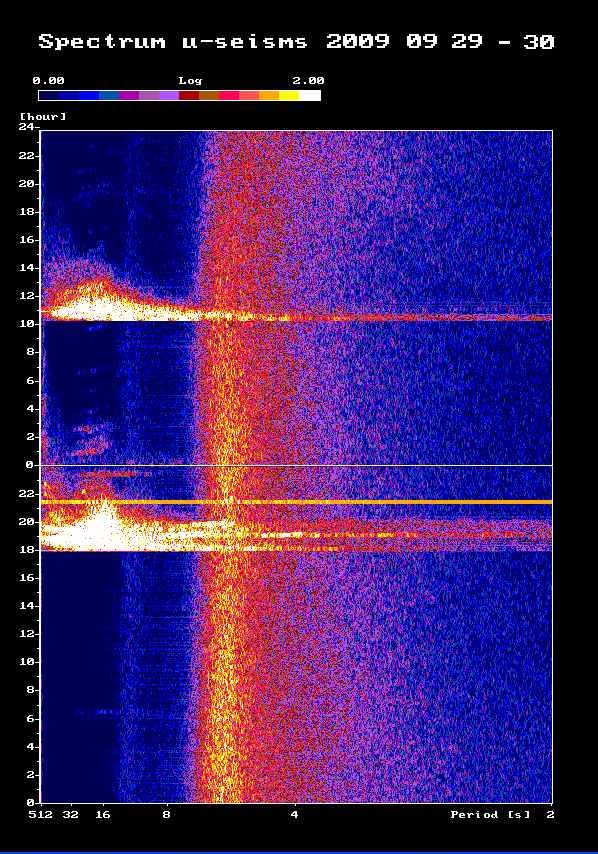
Figure 4 - Short-time Fourier transforms of the 1-s acceleration data
(1024 samples per batch, the window been shifted 256 samples). The
amplitude scale (colors according to the legend on top) is logarithmic.
On those particular days the microseismic level was a bit high (the
orange band between 5 and 6 Hz) - you can see that it wanes towards the
end of Sep.30.