USAGE:
tslg {
NOFILE | file.ts [
tslist-options ] } { +options | +
} [ psxy-options ]
PURPOSE:
Make a plot from
the binary file file.ts
A component of a
multi-component files are plotted with the -Llabel option.
In principle, even
ASCII-files can be processed; however, the tslist-options might
become tedious. A
suggestion is to pre-run an ASCII-BIN conversion.
For appending
BIN-files, a tslist-app job must be issued as a
pre-runner.
In ~/TD there is a
script tslapp specialized on gravimeter files.
If NOFILE is
specified, the call may just close the current plot (+cont,
no +keep).
This is useful if tslg
must be called inside a loop with an unknown number of courses.
(With +keep +cont
you may thus add a legend line.)
NOFILE can be
skipped if the first option is a nontrivial +option
Advertisement
Do you like a plot like this? Then consider tsllg
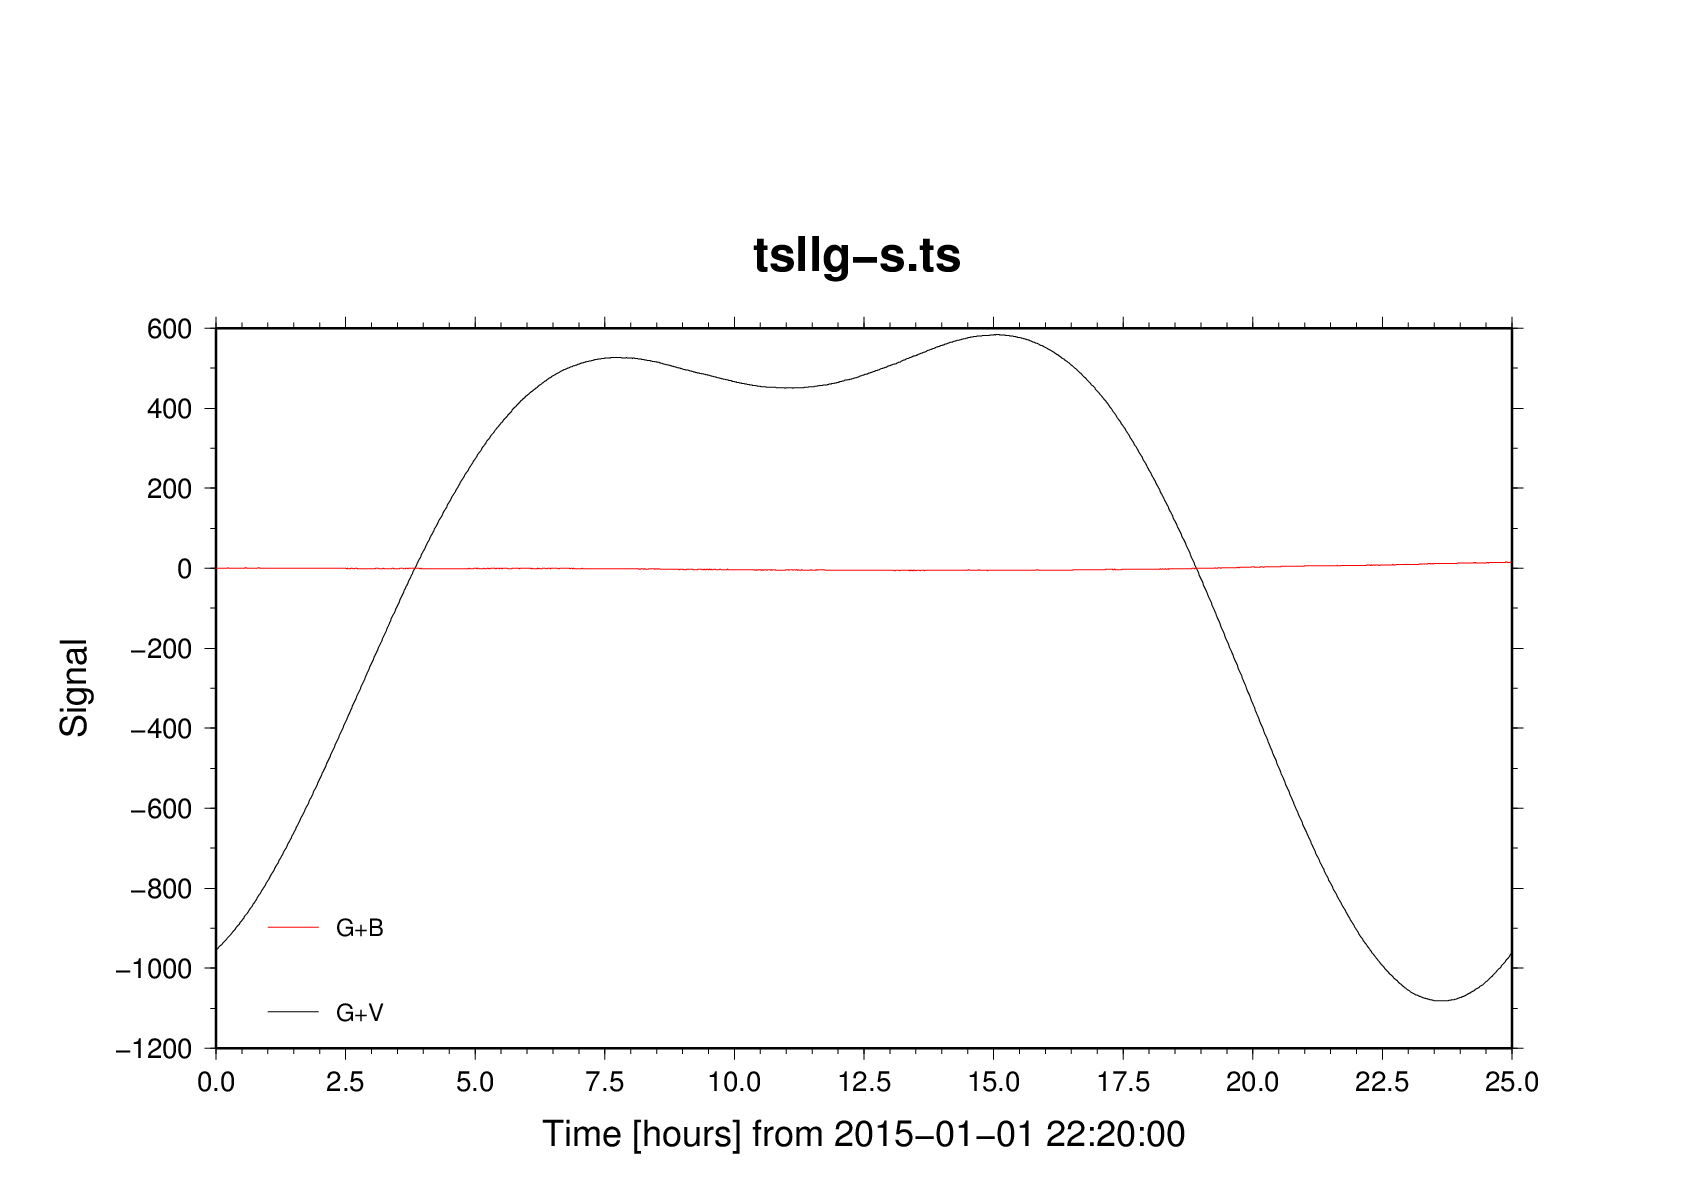
It was made with
tsllg -LUL -from
2015,01,01,00,00,00 -ls 32400 -L G+V -L G+B -D +M
"A title" +P testd.ps -
tslist-OPTIONS:
N.B.: This routine will run in a sub-directory
./plot/ (iff one exists).
Therefore, file
names in the option string have to either anticipate
the change to a
subdir (e.g. edit option -E../deci.tse,L ) or, for
convenience, the
file name can be prepended with `pwd`/
-tp[dfmt] - this is a
special code not recognized by tslist. Instead, the option is
expanded to -Ft1,f13.6,$dfmt -p2:1,2
-N -n1
suitable for t-point files. Default dfmt = f10.2
+OPTIONS:
Options
controlling this very script start with a `+´ sign.
They must be
kept together, i.e. they cannot be mixed with the options to
neither psxy nor
tslist.
If all-default
is intended, a lone `+´ must be given.
Some options work only
in the first (-F-), some only
in the last (-L-)
of a series of tslg
invocations.
+V
- verbose.
+VV
- verbose with set echo
+left -F- draw a y-axis
only to the left (intending a +right axis later);
default is the same axis left and right.
+keep -
don't close the plot yet. Additional curves can be added.
Take the curve with the widest
Y-range first, else you must
edit the .tslg file.
+cont
- continue on a previous tslg plot.
+first
- continue on a previous plot drawing
a new psbasemap.
+right
- continue on a previous plot but add a
right Y-axis.
Only one such extension and
ensuing ordinate scaling can be applied.
+S
- in combination with GMT -Woption: Staircase line
(boxcar, sample-and-hold)
default is a regular line
+H "words"
- headline. Default is derived from input file name.
With EMPTY as the only word, no headline is plotted.
With +LEG the headline goes into the
legend.
+H NOFEED - With
+LEG : If a curve must be composed of a number of
tslg calls
(e.g. plotting error bars, symbols and lines), the legend position
is not incremented and no text is added. Only the specimen is
placed.
+LEG ["a-opts"]::["p-opts"]
- prepare a legend. A legend item is added.
Without +keep the legend is drawn using the p-opts
a-opts -
Options for addlegend:
lines, symbols, colors, text rendering...
p-opts -L- Options for pslegend:
legend rendering, position, size...
If you need to add a curve manually and its legend entry, look here ("Additional legend entry")
+M "words"
-L-
a subtitle. Enclose more than one word within " "
With EMPTY as the only word, no subtitle is
plotted.
With +LEG the subtitle will be written
as the main title. This is the
last action before the plot is closed.
Without +LEG the subtitle will be written
in 14-pt font size
and placed centered inside the diagram
near the top.
A suggestion: Rely first on axes defaults
before you try and tailor them with
+YAX and +TAX .
The Calendar option isn't easy to handle either.
+T title -F- time-axis label.
Default = "Year". Shorthands exist, see below.
title may consist of more than one word. Everything is
taken as
title text until a leading `+´ is encountered. A lone + will
be
necessary before a coming `-´ option.
Since colons cause interference with the GMT title delimiter,
use the octal code \072 instead.
Example: +T "s from 03\07200\07200"
+ yields [s] from
03:00:00
Since brackets cause difficulties inside the script,
enclose a unit in double slashes. For example,
+T
Length //m// + will be translated to Length [m]
+T EMPTY
yields an untitled and
unenumerated axis.
+TAX
"opts" -F-
time-axis options for axlim4ts in addition to -RB
-pf10.3
+TAX F rlo/rhi ticks
-F- "forced" =
user-supplied parameters for GMT psxy -Rrlo/rhi and
-Bticks
+C title -L- add calendar, month
names, monthly divides, and 10-day ticks.
Rules for title are the same as under +T
+CF title
-L- like
+C, plus an alternating color background for each month.
+CO "opts" -L- options
for calaxis. Use calaxis -h for
information.
+Y title -
ordinate label. Default = "Signal". Shorthands exist, see below.
Rules for title are the same as under +T
+YAX "opt" - ordinate
options for axlim4ts in addition to -RB -pf10.3
+YAX F rlo/rhi ticks
- "forced"
= user-supplied parameters for GMT psxy -R../rlo/rhi
and -B../ticks
+YAX F0
- include zero in the axis range.
+P psfile
-F- PS output
(PNG too), default is derived from input file name and label:
`basename file.ts`.ps
or `basename file.ts`_label.ps
+A word -F- to add a word at the
end of the PS-file name (before the last `.´
+cc
- "continuous curve", removes the -m option in psxy.
+tn [tfile] -L- Make (i.e. renew) a
html page with a thumbnail collection;
requirement: PNGOUT has been set, and an
html-template
tfile (default:
/home/hgs/TD/tslg-collection_html.template) exists
(~/bin/make-img-index-html is used)
+EMPH color - very special,
apply together with psxy option -S for a symbol that can
be filled (e.g. -Sc0.8) : Plot the abs-max point
filled with color
(cannot change the outline colour nor the stroke).
+EMPHMIN color emphasize the data
minimum
+EMPHMAX color
emphasize the data maximum
For control from environment, setenv KINDEMPH {-1|0|+1}
and
specify option +EMPH color to emphasize {min|max-abs|max}.
What we don't offer (yet) is both.
PSXY OPTIONS:
You probably need -m for coping
with gaps. That's a default.
If that's a problem, use option +cc
(continuous curve)
-W3/0 - the default.
SHORTHANDS FOR AXIS TITLES:
TIME AXIS, first element of string:
y | j | any
-> [Years] | [MJD] | [any]
The default will yield Time [-]
second element of string:
@
-> "on date" where date is derived from input file
ORDINATE:
g | a | p
-> "Gravity [nm/s@+2@+]" | "Acceleration [nm/s@+2@+]"
| "Pressure [hPa]"
Shorthands can be extended; edit the script at "# Shorthands:"
or
write a csh source script with definitions. The variables
are called
tunits
and yunits.
ENVIRONMENT:
PNGOUT - the
directory where to put the final PNG-file. Defaults to PNG/
or plot/PNG or plot/ or ./
PNGRSL - the
resolution of the final PNG plot. Default = 144x144
TSLG_FRAME - the size of the
diagram, default = -JX9/5
TSLG_XORIGIN - the horizontal
distance between the left paper edge and
the diagram's origo. Default 1.5
TSLG_YORIGIN - the vertical
distance between the lower paper edge and
the
diagram's origo. Default = psbasemap's default.
TSLG_LEGFEED - 1 or -1 for legend
entries going up or down. Default is 1, up.
FILES:
If a
file
./.tslg.shorthands
exists, it
will be sourced.
The
PS file name is stored in
(plot/).tslg.ps
for re-use
with +cont or +right
A
little csh source script for parameter setting is saved /
loaded:
(plot/).tslg
(plot/).tslg.basemap-left
(plot/).tslg.basemap-right
- output only, maybe
useful for interspersing GMT commands
Contains
axes ranges and projection/diagram size
EXAMPLES:
setenv PNGOUT ~/www/4me/tslg/
tslg d/g100201-130515-1h.mc -L'B|V'
-BHc2012,5,1 -U2012,7,1 +T Year +Y "Air pressure [hPa]" \
-m -Sc0.03
-W1/0 -G0
Note: In this example, tslist's default time format is used, float
years.
With -N time tags, the
calendar option will not function.
RJD and floating-point
years are possible with +C
tslg d/G1_garb_131125-1s.mc
-L'G|B' -E`pwd`/deci.tse,D10 -N -n/360 -D \
-BHc2013,11,25,6 -U2013,11,25,7,20 -D \
+T "Hours on 2013-11-25" +Y
"Gravity [nm/s@+2@+]" \
+P
eq_SouthAtlantic_2013-11-25_06-07.ps \
+M "USGS:
2013-11-25 06:27:33 (M7.0) SOUTH ATLANTIC OCEAN -53.9 -54.9
(43a6c)"
tslg d/G1_garb_131125-1s.mc -L'G|B' -N
-n/3600 +
A
bare minimum. We specify -N -n/3600
in order to get labels and ticks in units of hours (incl. an
offset from midnight)..
A single-component
file spanning more than a year would cope with
tslg file.ts +
A particularly nice example
is in Ttide/SCG/prl-files-and-coeffs
Another nice one in TD/cal1504/calplot
calplot +P +O -ph
A quick-view into a multi-year
MC-file, plotting all components:
foreach label ( `tslql -L, file.mc` )
tslg file.mc $label +
end
For shorter and much shorter
files you'll need some ascii output options of tslist
Drawing tilt control curves:
setenv PNGOUT $pngout
tslg d/A1_t_090701-ystrdy-1h.mc -LTX
-E`pwd`/tiltclean.tse,C \
+keep +T y +LEG
-W8/0/0/255:: +P A1_t_090701-ystrdy.ps +H TX-Power -W3/0/0/255
tslg d/A1_t_090701-ystrdy-1h.mc -LTY
-E`pwd`/tiltclean.tse,C \
+cont +LEG
-W8/255/0/::-JX2/0.5 +H TY-Power \
+M "Tilt control
up to "`tslqd e -: d/A1_t_090701-ystrdy-1h.mc` -W3/255/0/0
from ~/TD/tilt-control-monitor . With legend.
Additional legend entry:
cd plot/
source .tslg
# plot your curve, e.g. with
psxy -R$tax[1]/$yax[1] -JX -K
-O -W3/128 >> PS/ps-file
# you can obtain the ps-file name with
eval
`head -1 .tslg.ps`
set yleg=`echo "SCG resid" | addlegend -y$yleg -d1
-W7/128`
echo set yleg = $yleg >> .tslg
cd ../
or simpler with the special script
~/bin/tslg-addlegend
cd plot/
source .tslg
set ps=`tslg-addlegend "SCG
resid [@~m@~Gal]" -W3/128`
psxy ... >> PS/$ps
cd ../
.bye