Caption for the station maps
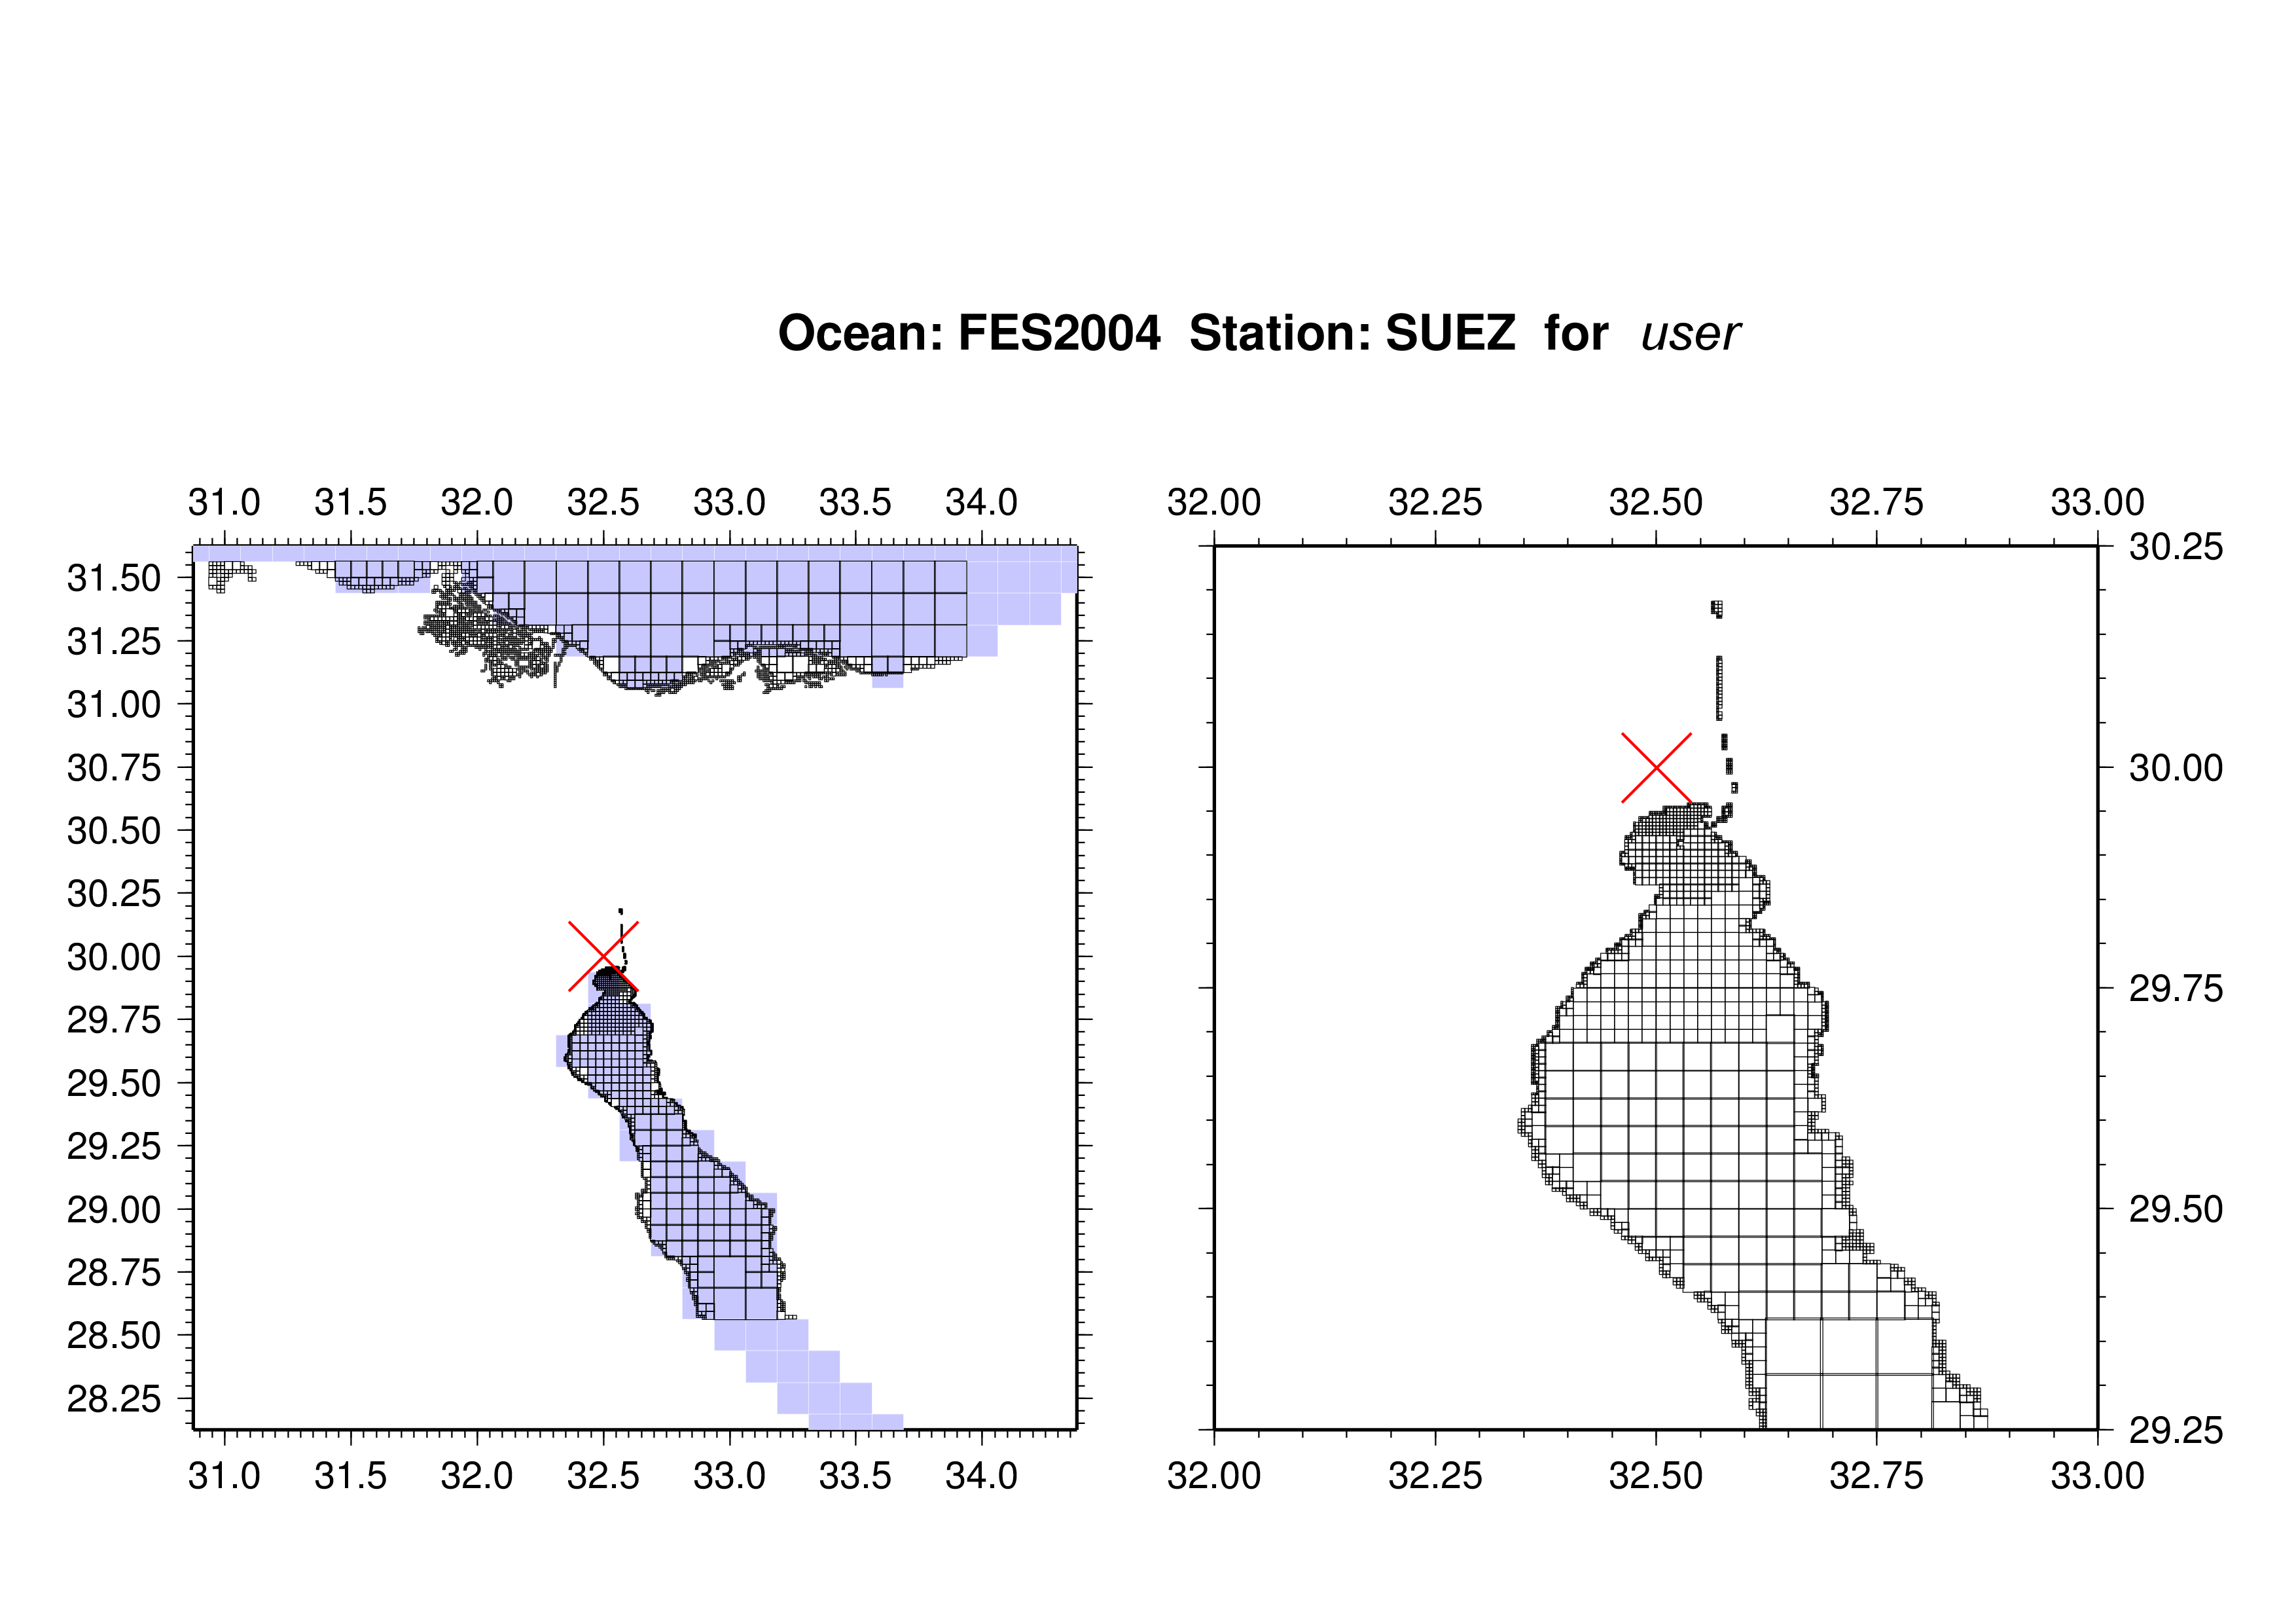
The left diagram shows the refinement of the loading grid using a
quad-tree algorithm, partly controlled by the distance to the
observing station and partly by fragments of land inside a grid
cell. For the latter
the coastlines distributed in the GMT software (full resolution).
Every square outlined with a black line is represented as a point mass
in the convolution with the loading Greens's functions. The
mass is interpolated on the ocean model's grid–or extrapolated if
the coastline points them out as sea cells but happen to lie on dry
cells of the model. The observing station is indicated with a
red leaning cross. The blue tiling represents the grid cells of the
global model, again represented by one point mass each.
The right diagram zooms into the inner 1o×1o quadrangle around the
station. Grid refinement is employed in a post-processing stage when
the loading calculation finds station positions that are closer to
the ocean than three degrees of arc.
––––––
Owing to logistic reasons we cannot provide this kind of plots for the high-resolution tide models
FES2014b FES2012 TPXO8* TPXO9* (but TPXO9.5a has an uncritical resolution, so we can).