The Superconducting
Gravimeter: Earthquakes
This page is primarily on events that don't belong to
the catastrophic group. See our news
page.
Here, we concentrate on regional earthquakes and those which
are at the limit of detectability with the gravimeter.
Q.: Did the Superconducting Gravimeter "feel" the
M4.1 Earthquake in Northern Dalarna / Orsa Finnmark,
2014-SEP-15?
A: Definitely yes!
B.t.w. EMSC, the European-Mediterranean
Seismological Centre at Strasbourg lists its magnitude
at 4.9. The lower values is SNSN's estimate, in agreement with
the CMT assessment (Björn Lund, Uppsala university,
pers.comm.). CMT is the Global Centroid Moment Tensor project
lead by Göran Ekström at Harvard. (The event is not in the
searchable data base).
The epicentre coordinates I received from Björn place
the event just south of the border to Jämtlands län
(Härjedalen). SNSN tells us that the region is southern
Härjedalen. We shall not engage in a dispute due to round-off
error and re-estimation (0.01 degrees is about 1 km).
The larger distance from Onsala to this event causes
more surface wave energy at longer periods to pass the
anti-aliasing filter of the gravimeter's recording system. The
events near Halmstad and Falkenberg (further down on this
page) were met with more attenuation owing to their higher
frequency content.
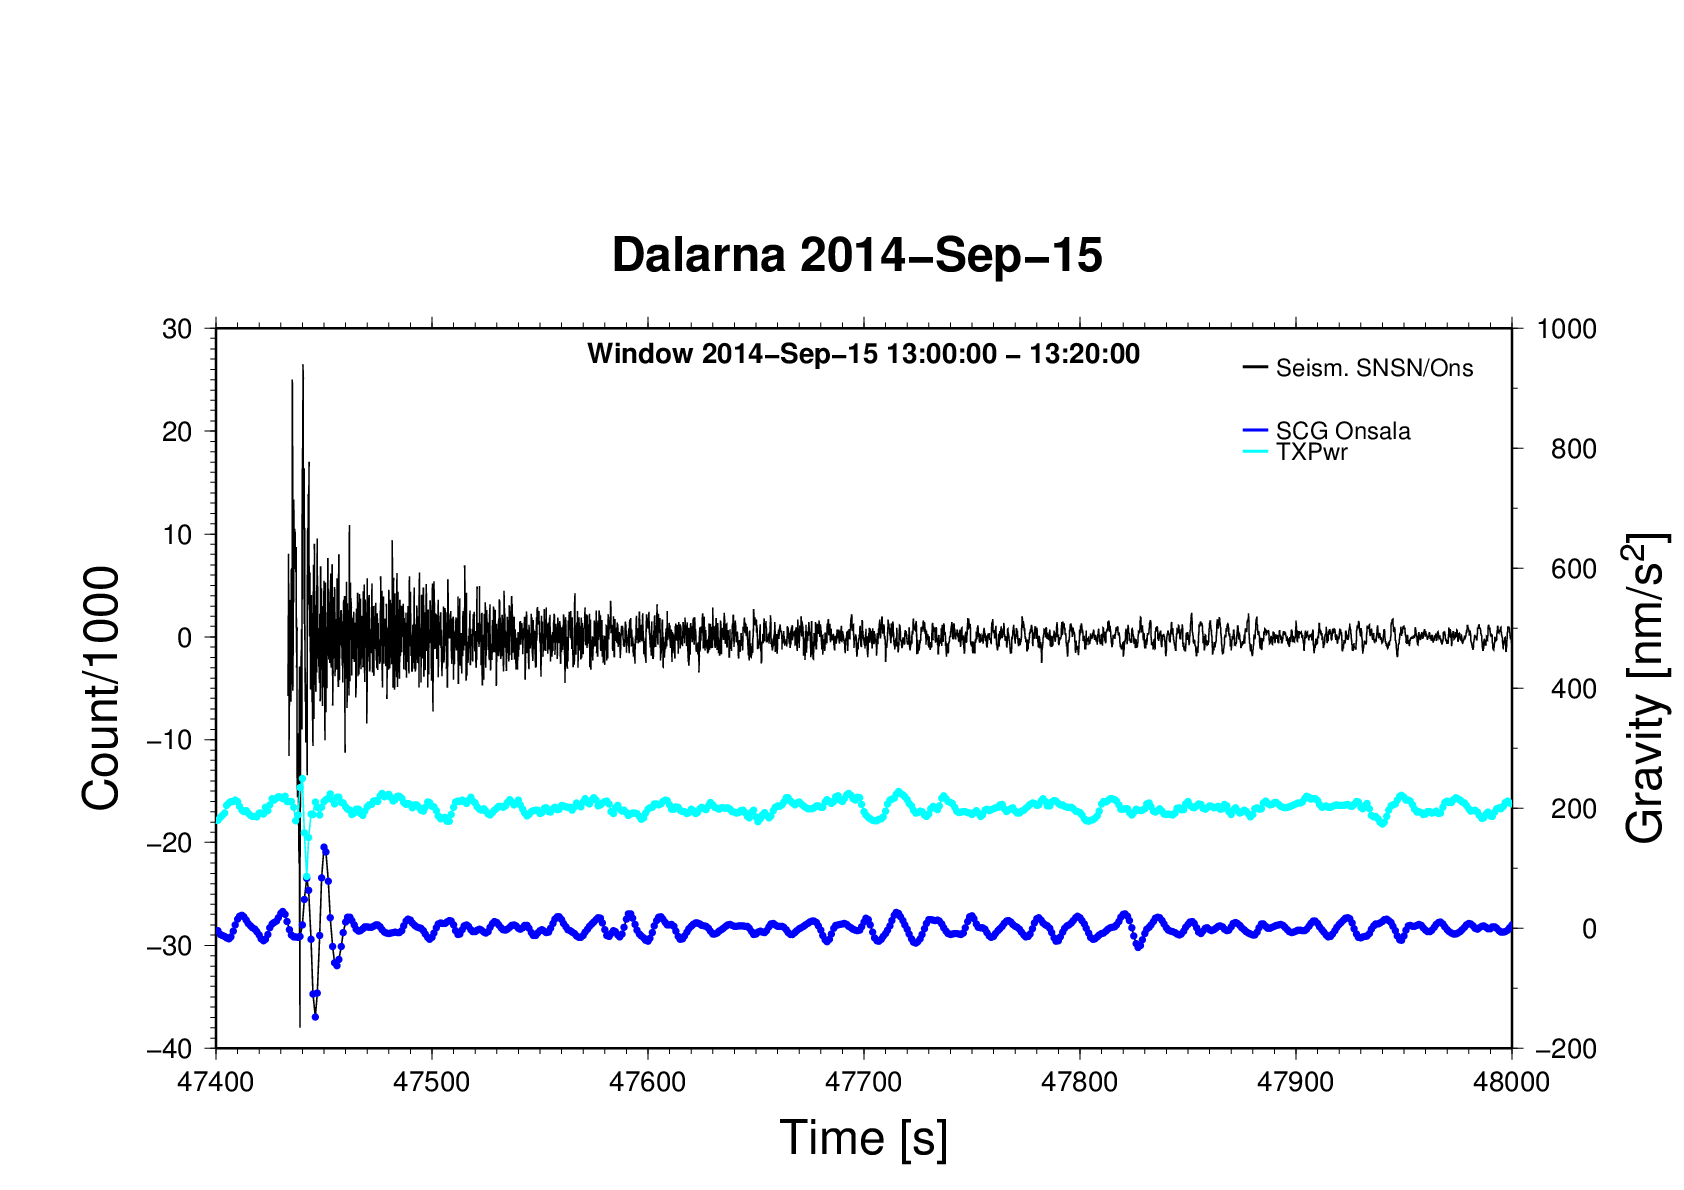
The SNSN seismometer at Onsala did have problems in
September, seen as frequent interruptions of the data stream.
Nor could missing data be salvaged from the recording system's
hard disk. Therefore, the part of the wave train of first
arriving body waves is missing in the diagram above; it's the
surface waves (Rayleigh) that you see. Surprisingly the
verticality system of the gravimeter became engaged. It's
purpose is to keep the instrument aligned in the vertical.
Horizontal accelerations are equivalent to a tilting of the
instruments. The feedback control is sufficiently fast to send
a correcting signal to the pistons mounted in the gravimeter's
feet. This signal is represented by the light-blue curve above
(TXPwr = electrical power to the tilt-control in the
X-direction).
About EMSC
and SNSN and CMT
An earthquake of about the same magnitude occurred in
Northern Italy on Aug. 28, 2014. The signal the gravimeter has
recorded is much clearer and complete. Goto our collection of
earthquake
plots. The file name starts with Garda...
Q.: Did the Superconducting Gravimeter "feel" the
M3.57 Earthquake near Halmstad, 2012-AUG-06?
A: Sure!
The 0.5 Hz Nyquist filter did not attenuate the wave train enough,
so that motion can be seen in the gravity channel. Comparing with
the seismograms from the SNSN (Uppsala university) seismometer
at Onsala suggests that most of the signal energy is at much higher
frequencies than 0.5 Hz.
Here are the figures, Fig. 1 from the SNSN home page, Fig. 2
showing the gravimeter signal, and Fig. 3 the three channels of the
seismometer.
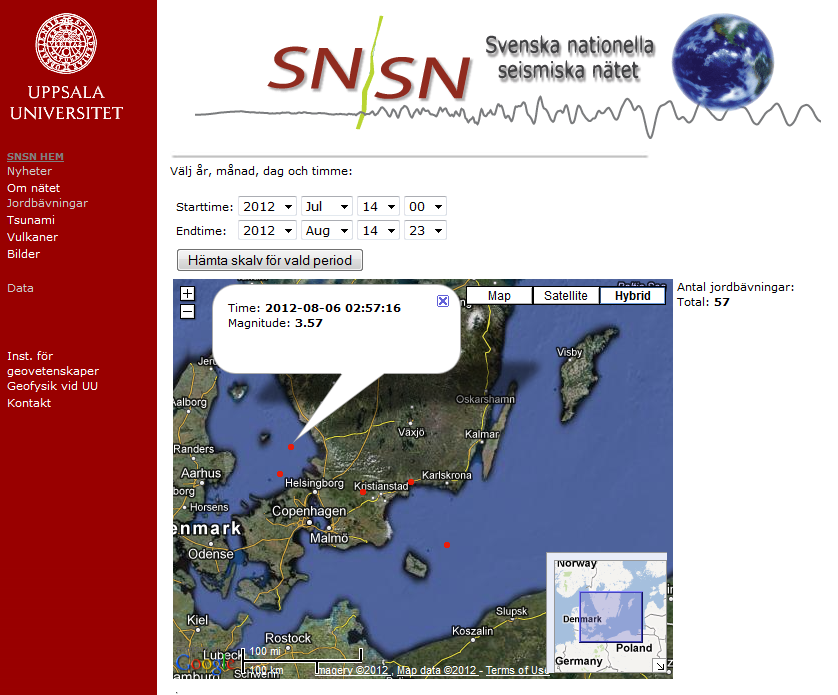
Fig. 1
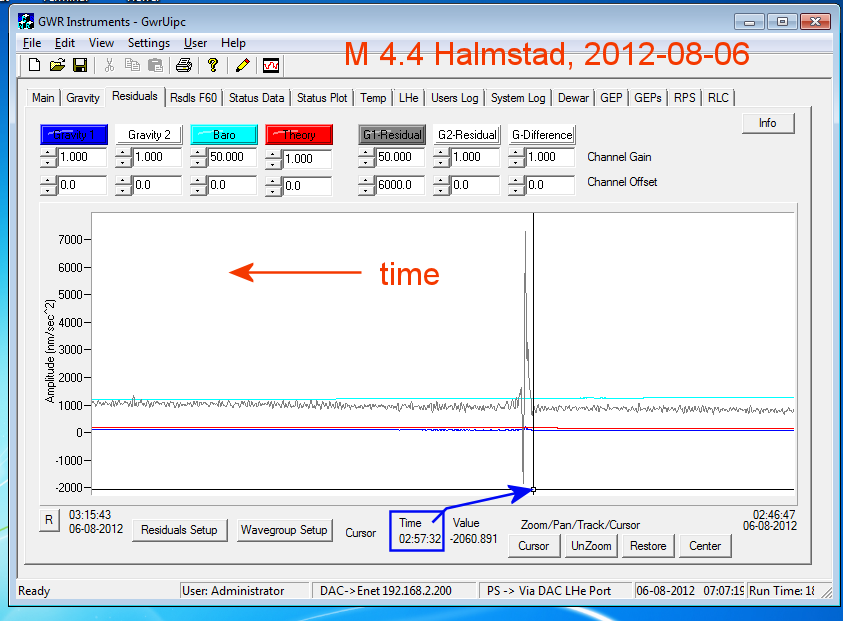
Fig. 2 - Gravimeter. Length of the record is 29 minutes short of 4
seconds.
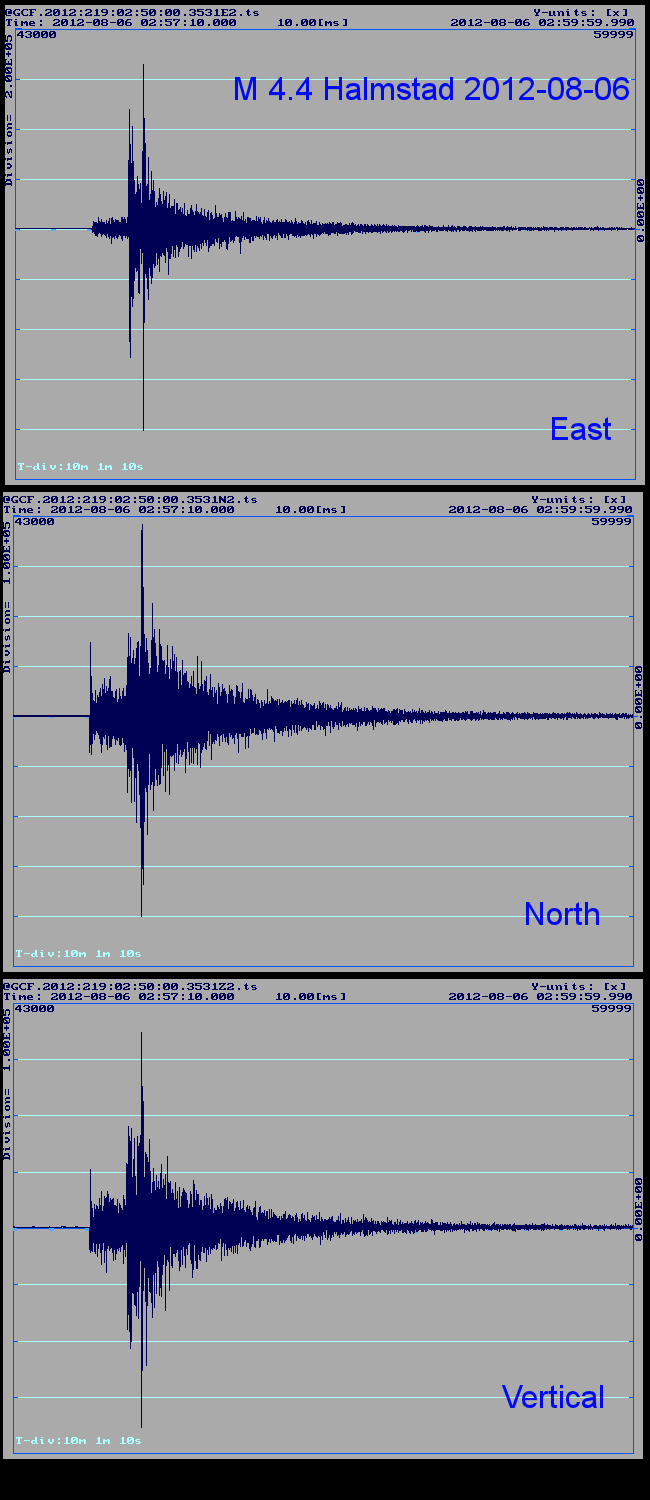
Fig. 3 - Seismometer. Length of the record is 2 minutes and 50
seconds, time progressing towards the right.
For better comparison with the seismometer, here's the gravity
signal (oversampled at 10 Hz) for the same time interval
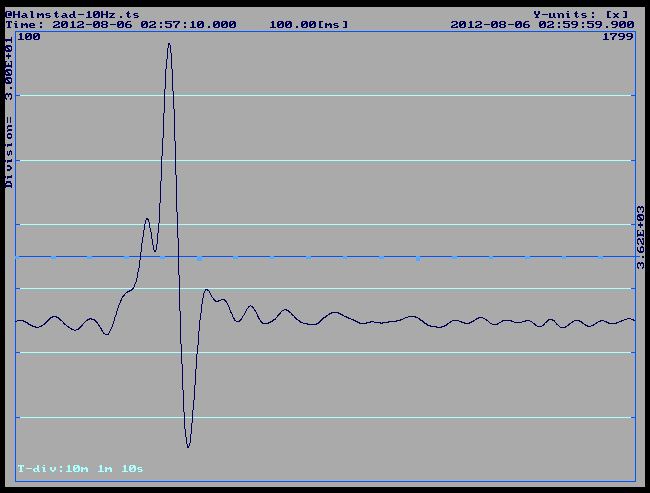
Fig. 4 - Gravimeter signal after resampling - remember that the
signal is based on 1-second sampling after an anti-aliasing filter.
The apparent low-frequency content is misleading.
Q.: Did the
Superconducting Gravimeter "feel" the M2.2 local Earthquake near
Falkenberg, 2012-JAN-08?
A: Certainly, but you cannot see its signature in the 1-second
sampled data. Events like this will be recorded in the future when
the installation of the Quanterra Q330HR is completed.
In Fig. 4 an example of an earthquake is shown that is visible in
the SG record.
SNSN at
Uppsala University wrote:
2012-01-09
07:01: Ett jordskalv med magnitud 2.2 inträffade på
söndagskvällen den 8/1 kl. 18:14 strax utanför kusten 10 km
sydost om Falkenberg. Skalvet skedde på 13 km djup och kändes av
många människor i närområdet.
The distance to Onsala Space Observatory is 77km. See Fig. 1
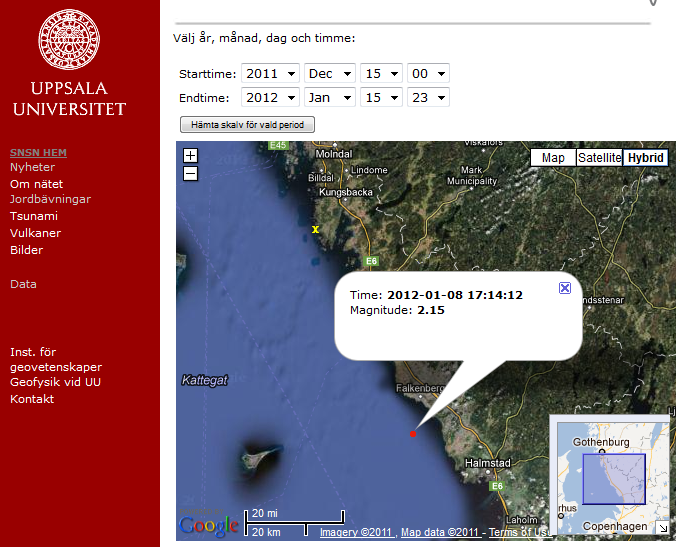
Fig. 1 - SNSN's account of the Falkenberg earthquake. The yellow X
shows the location of Onsala Space Observatory.
On the Superconducting Gravimeter, the recording shows the typical
microseismic background (Fig. 2), wave packets centred on an 8-10 Hz
frequency; no sign of the Falkenberg event can be identified. A look
at the power spectrum of the seismometer, once with the earthquake
in the time window and once from a time segment 10 minutes before,
shows that practically all signal power is located a decade higher
in frequency than the Nyquist frequency of the gravimeter's 1-s
sampling. An anti.aliasing filter in the gravimeter rejects signal
with frequencies above 0.2 Hz (Fig. 3).
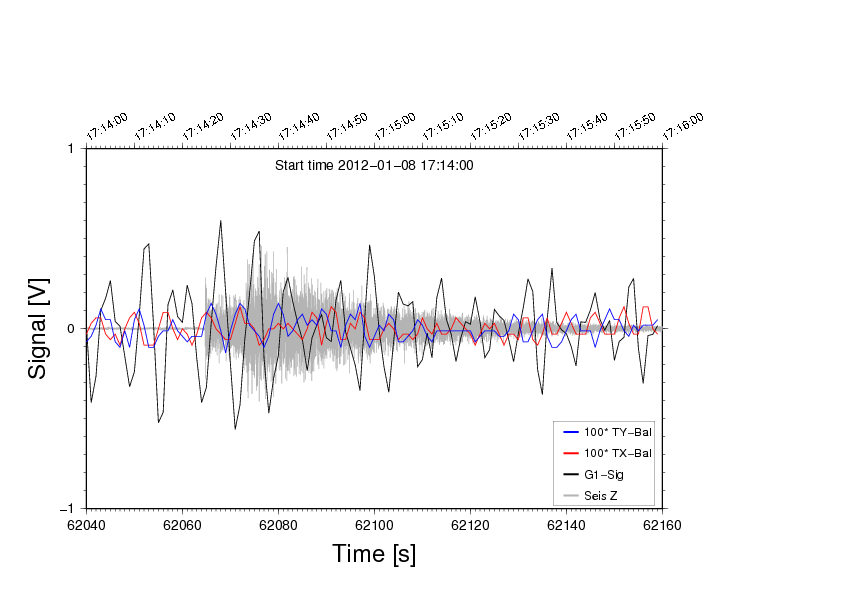
Fig.2 - The signal from the SNSN seismometer located in the
gravimetry lab at Onsala (gray), sampled at 0.01 s, and three
channels from the gravimeter, sampled at 1 s.
The gravity signal is shown in black. The red and the blue curves
show the two tilt sensors.
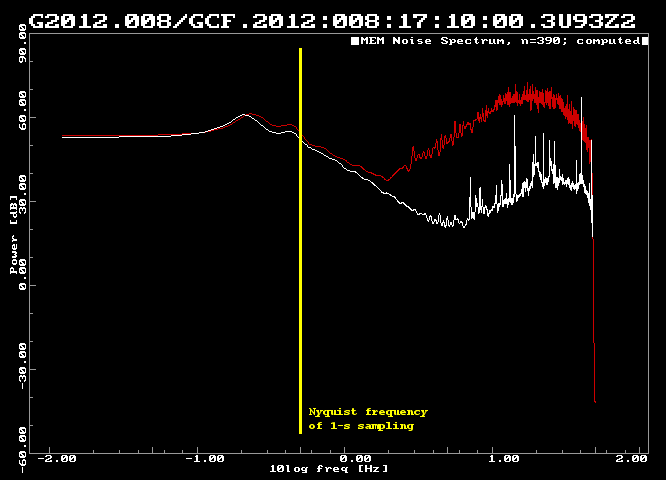
Fig. 3 - Power spectrum of the Z-component of the Seismometer at
Onsala, converted into acceleration. The white curve is from a time
segment without an earthquake signal, the red one includes the
Falkenberg event. The spikes at 6 Hz and above in the
earthquake-free curves are vibrations probably due to the
liquid-Helium compressor in the gravimetry lab.
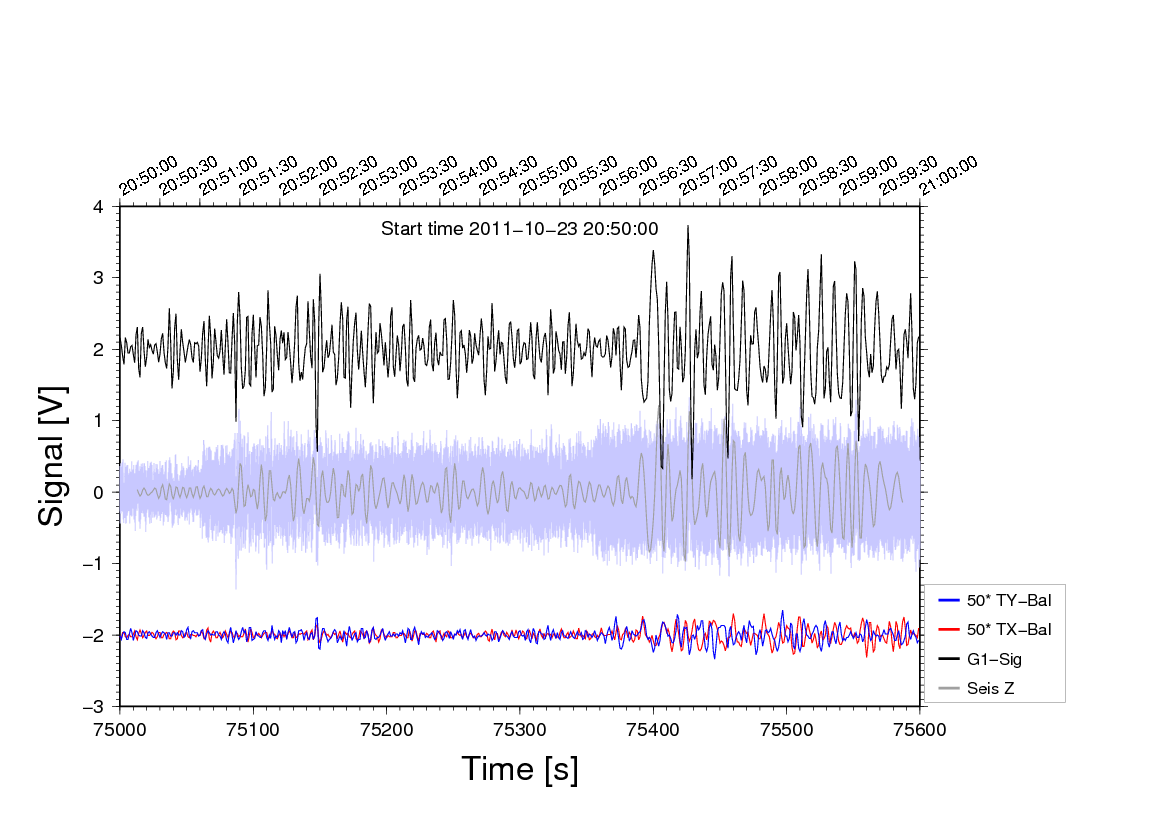
Fig. 4 - Earthquake in Turkey, lat. N38.634° long. E43.077°,
Magnutide 5.9, Source time 2011-OCT-23 20:45:34 UT (parameters from
USGS)
The black line, vertical acceleration, and the red and blue lines
(tilt sensors) are observed with the Superconducting Gravimeter. The
SNSN Seismometer at Onsala recorded the light-blue line (converted
to acceleration, 0.01 s sampling rate); the dark gray line inside
the wiggling band shows the same signal, however low-pass filtered
and resampled to 1 s.
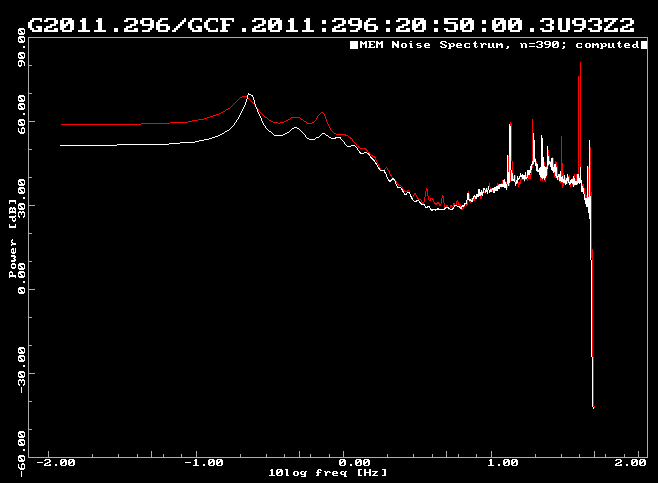
Here's the corresponding spectrum, during the earthquake (red) and
half-hour before (white)
.bye