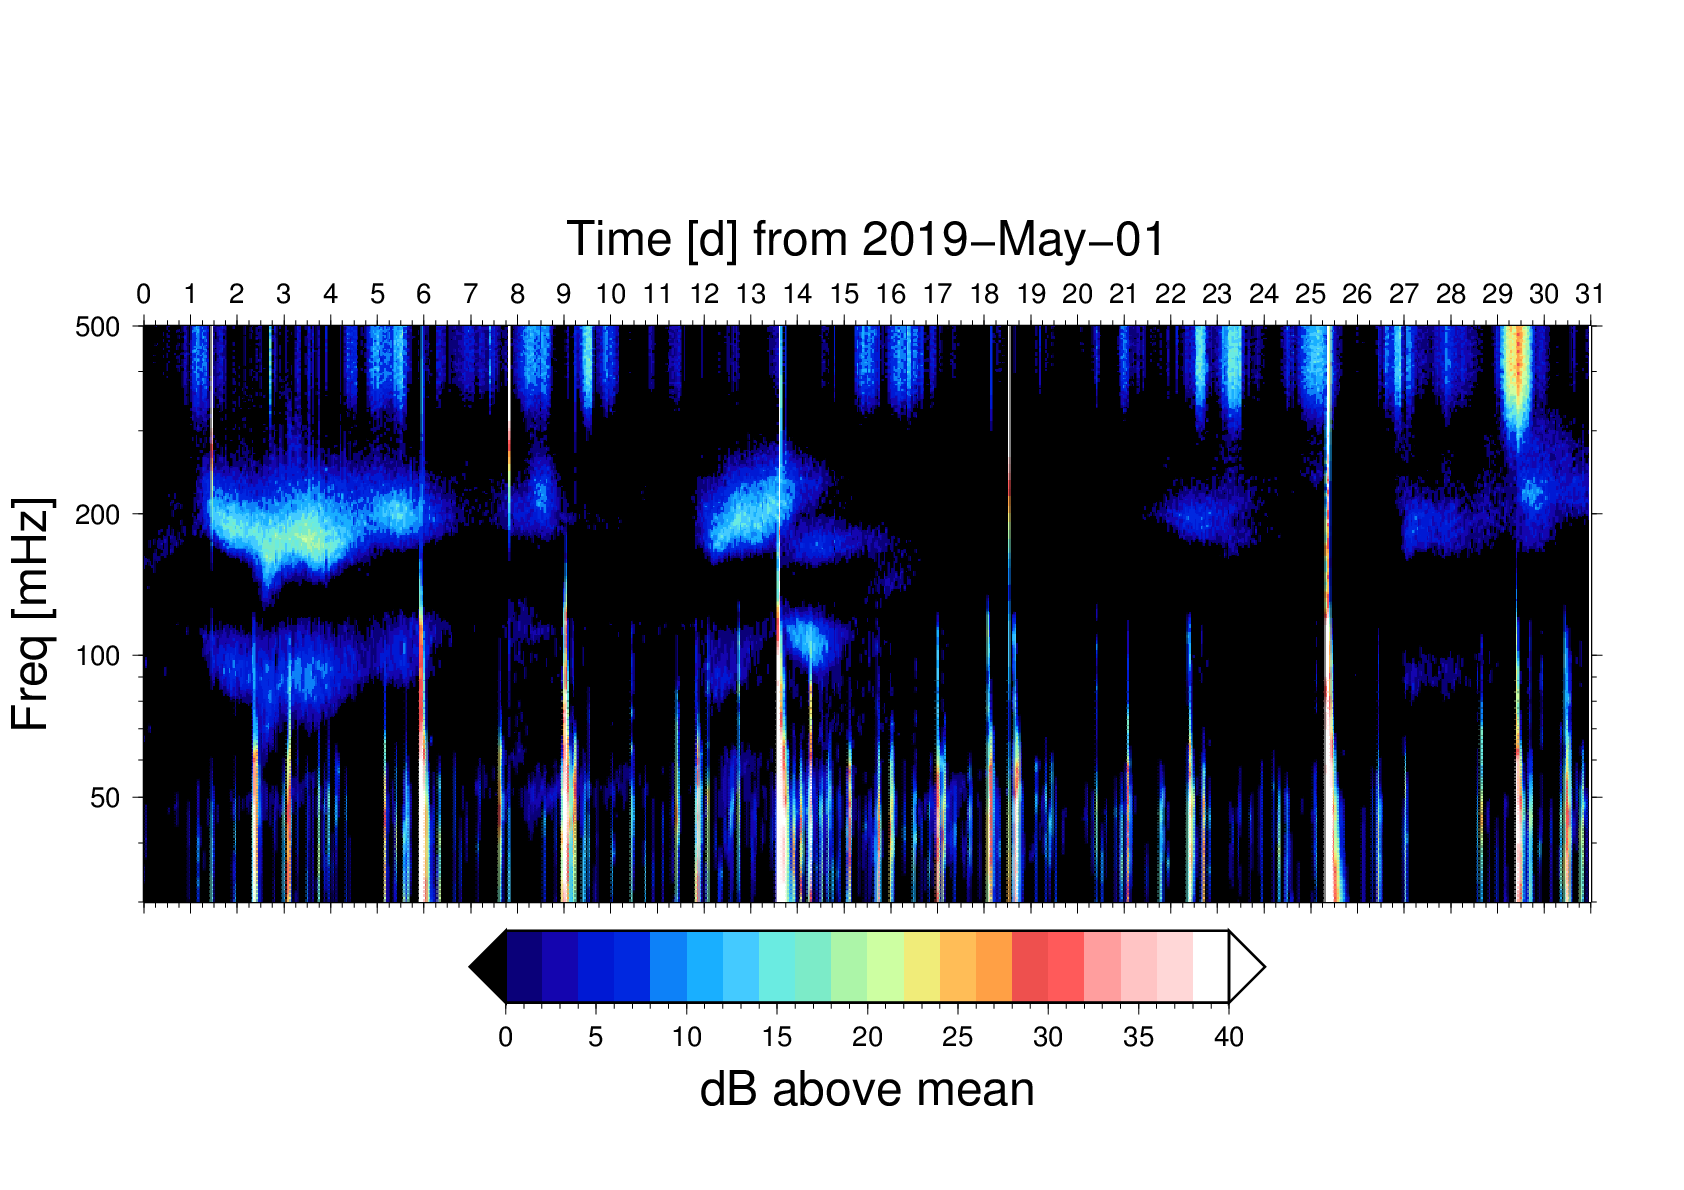
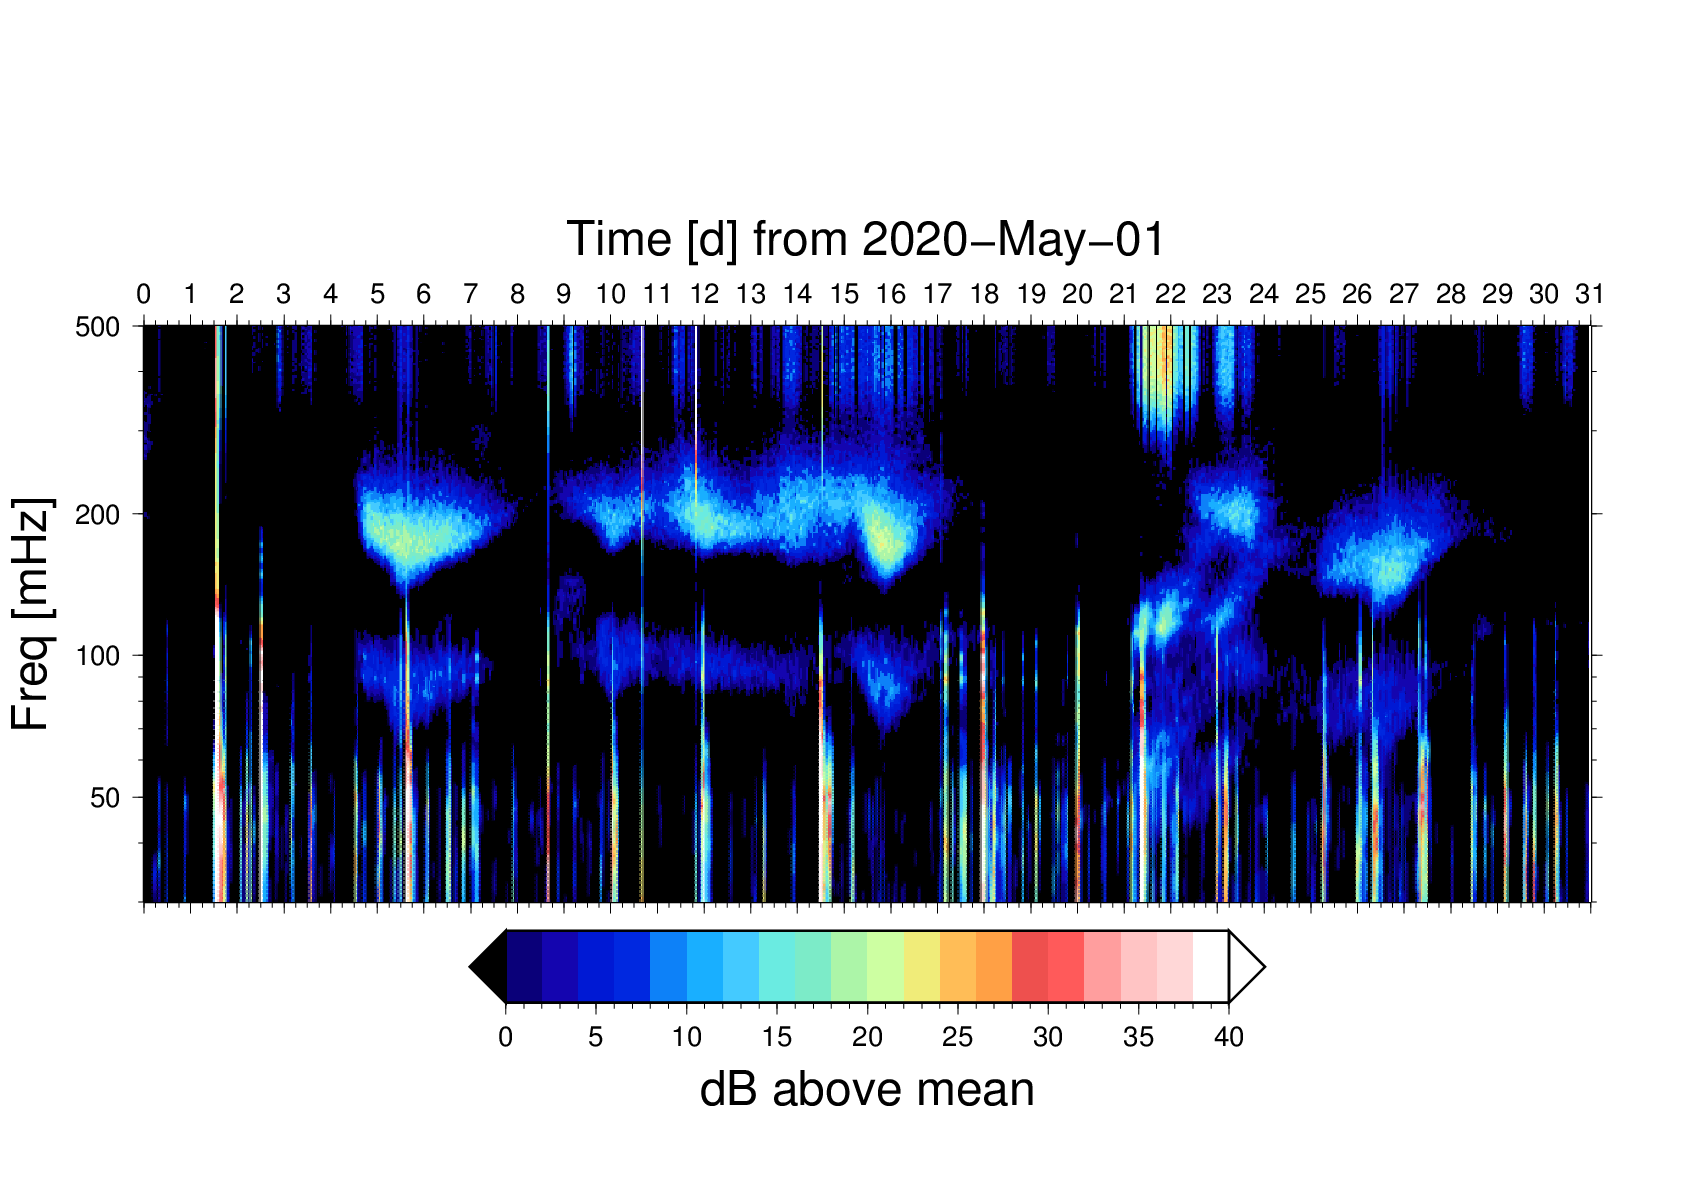
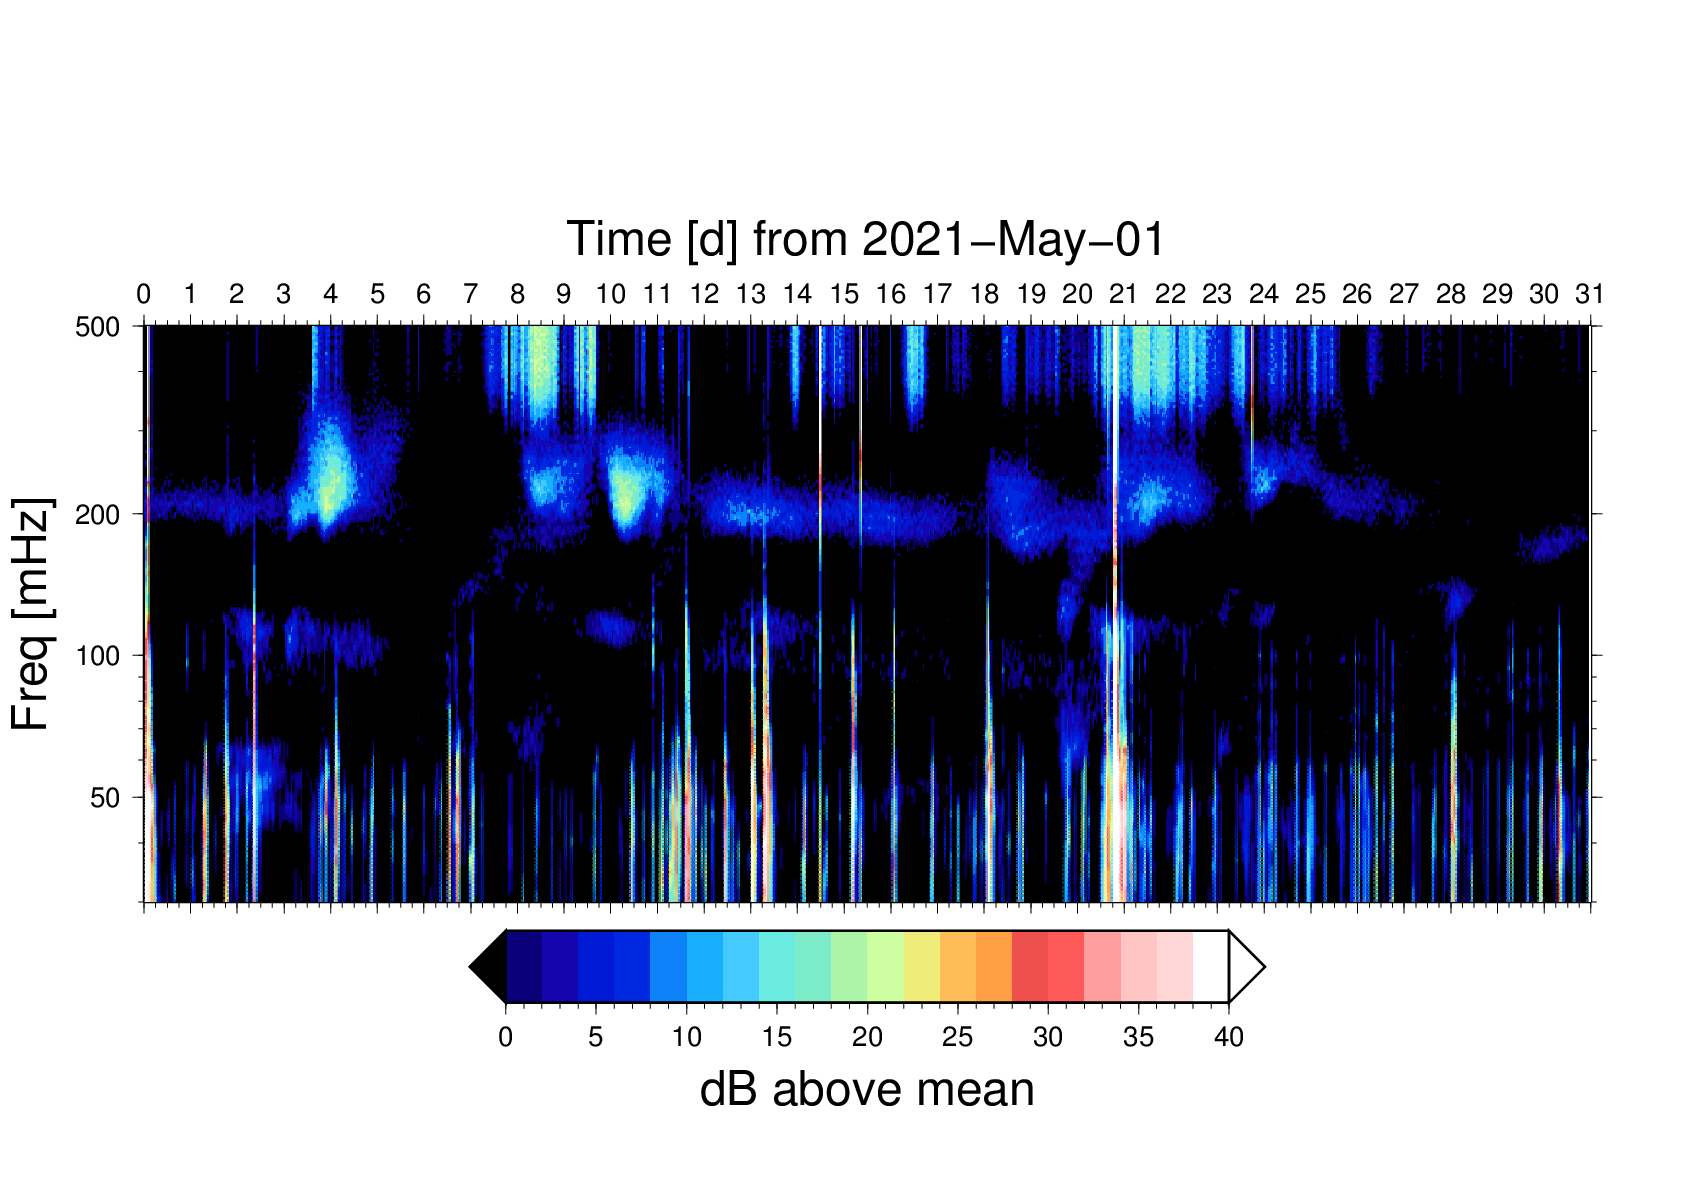
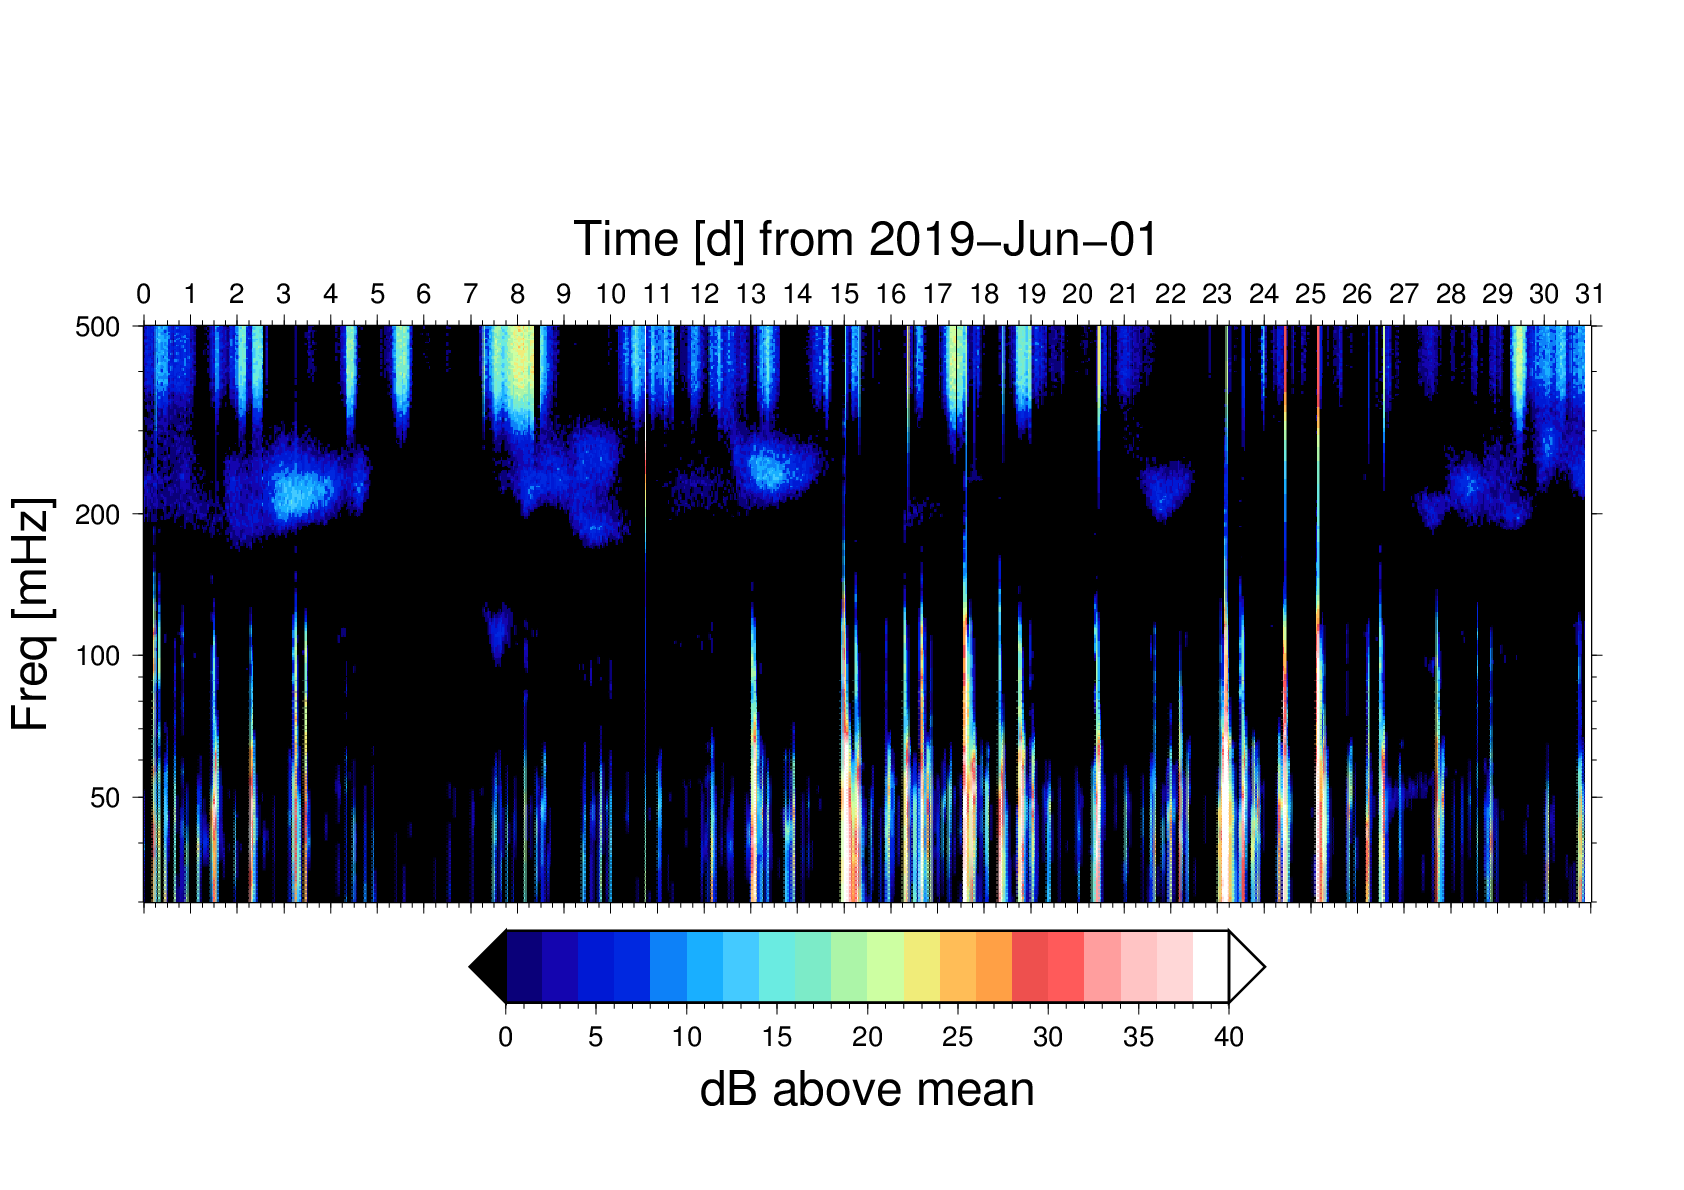
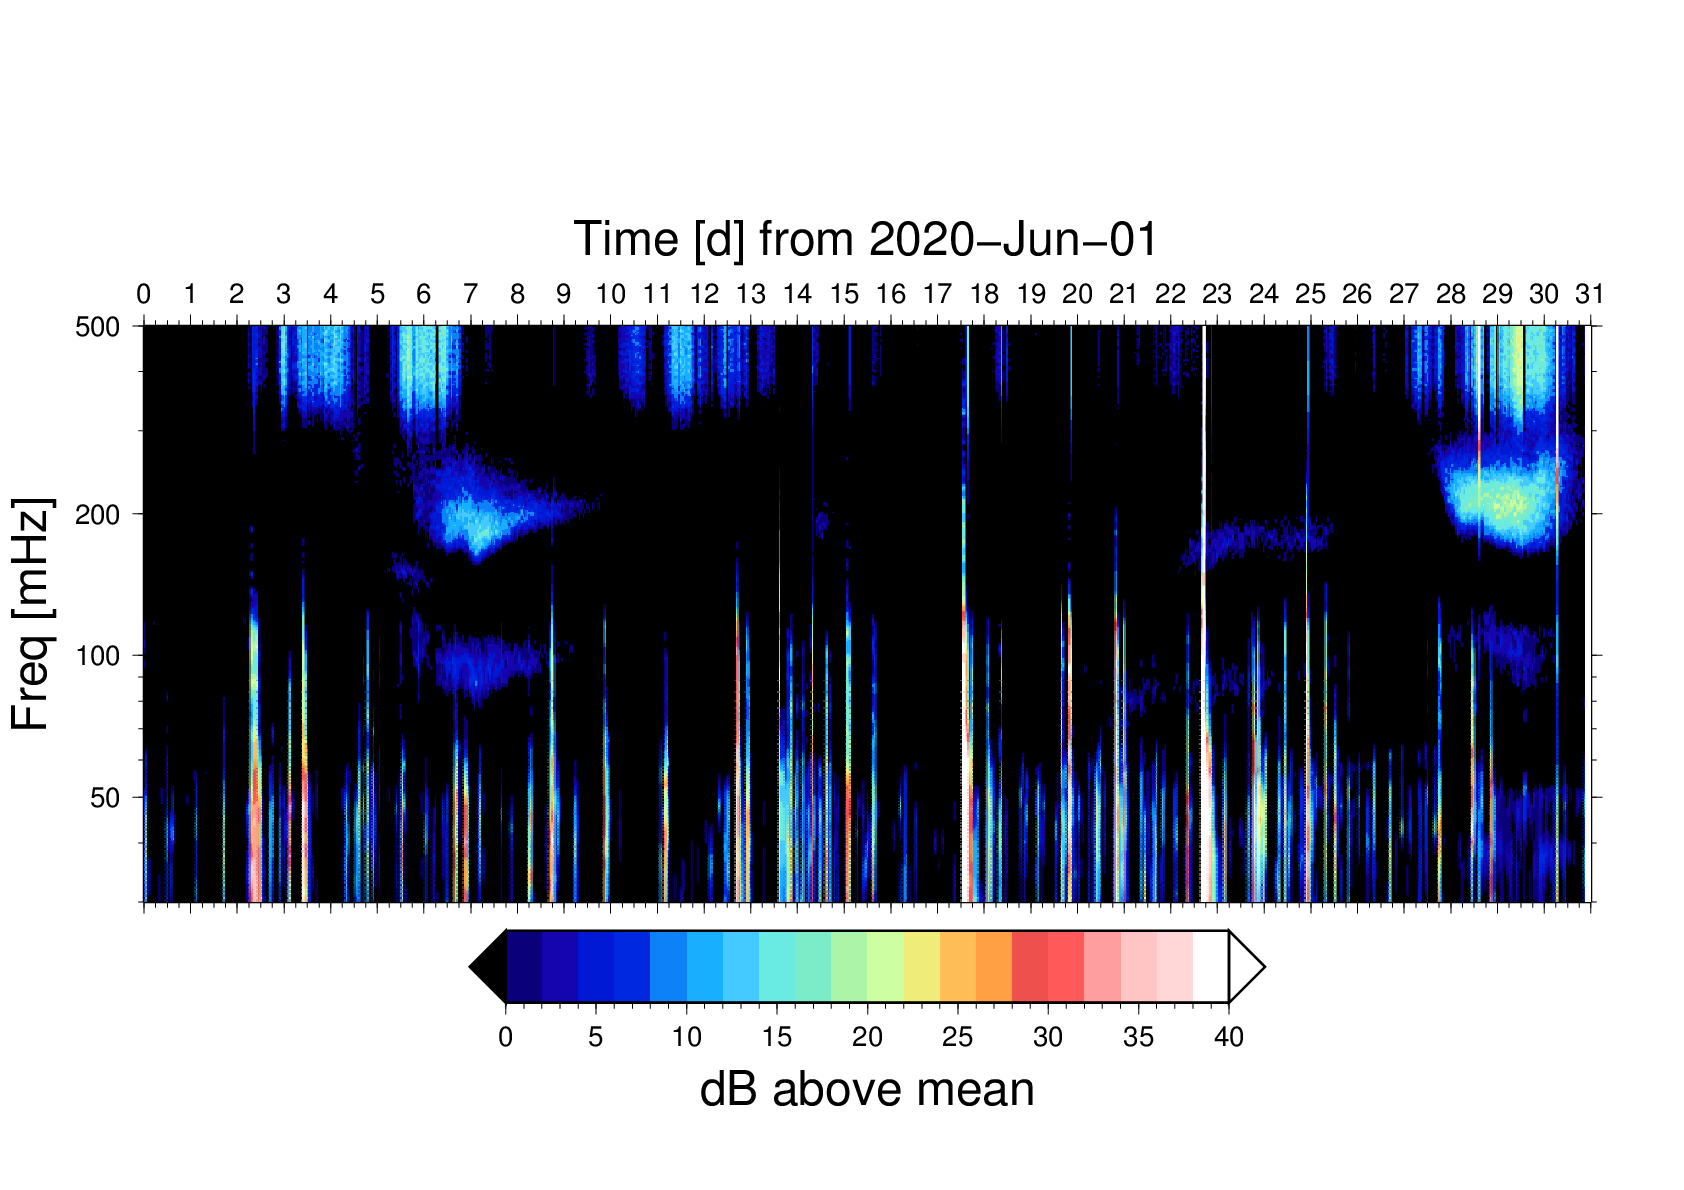
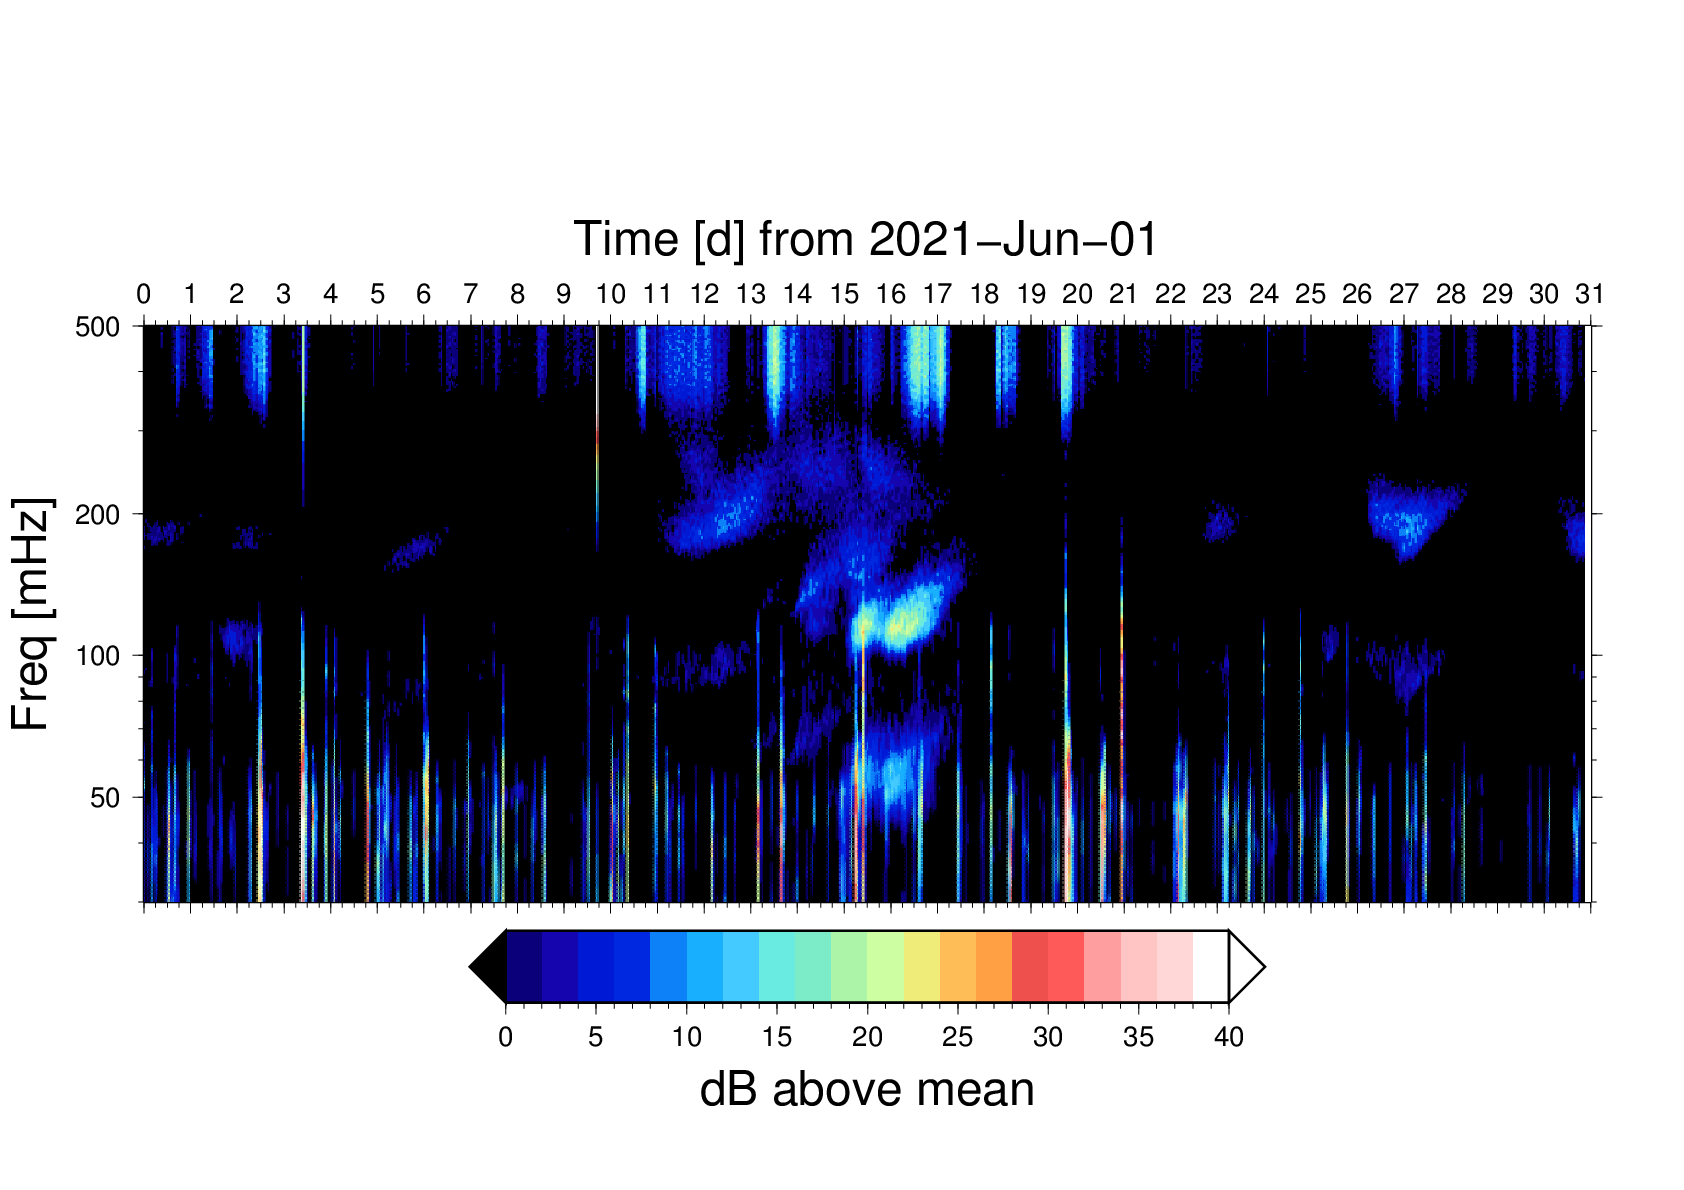
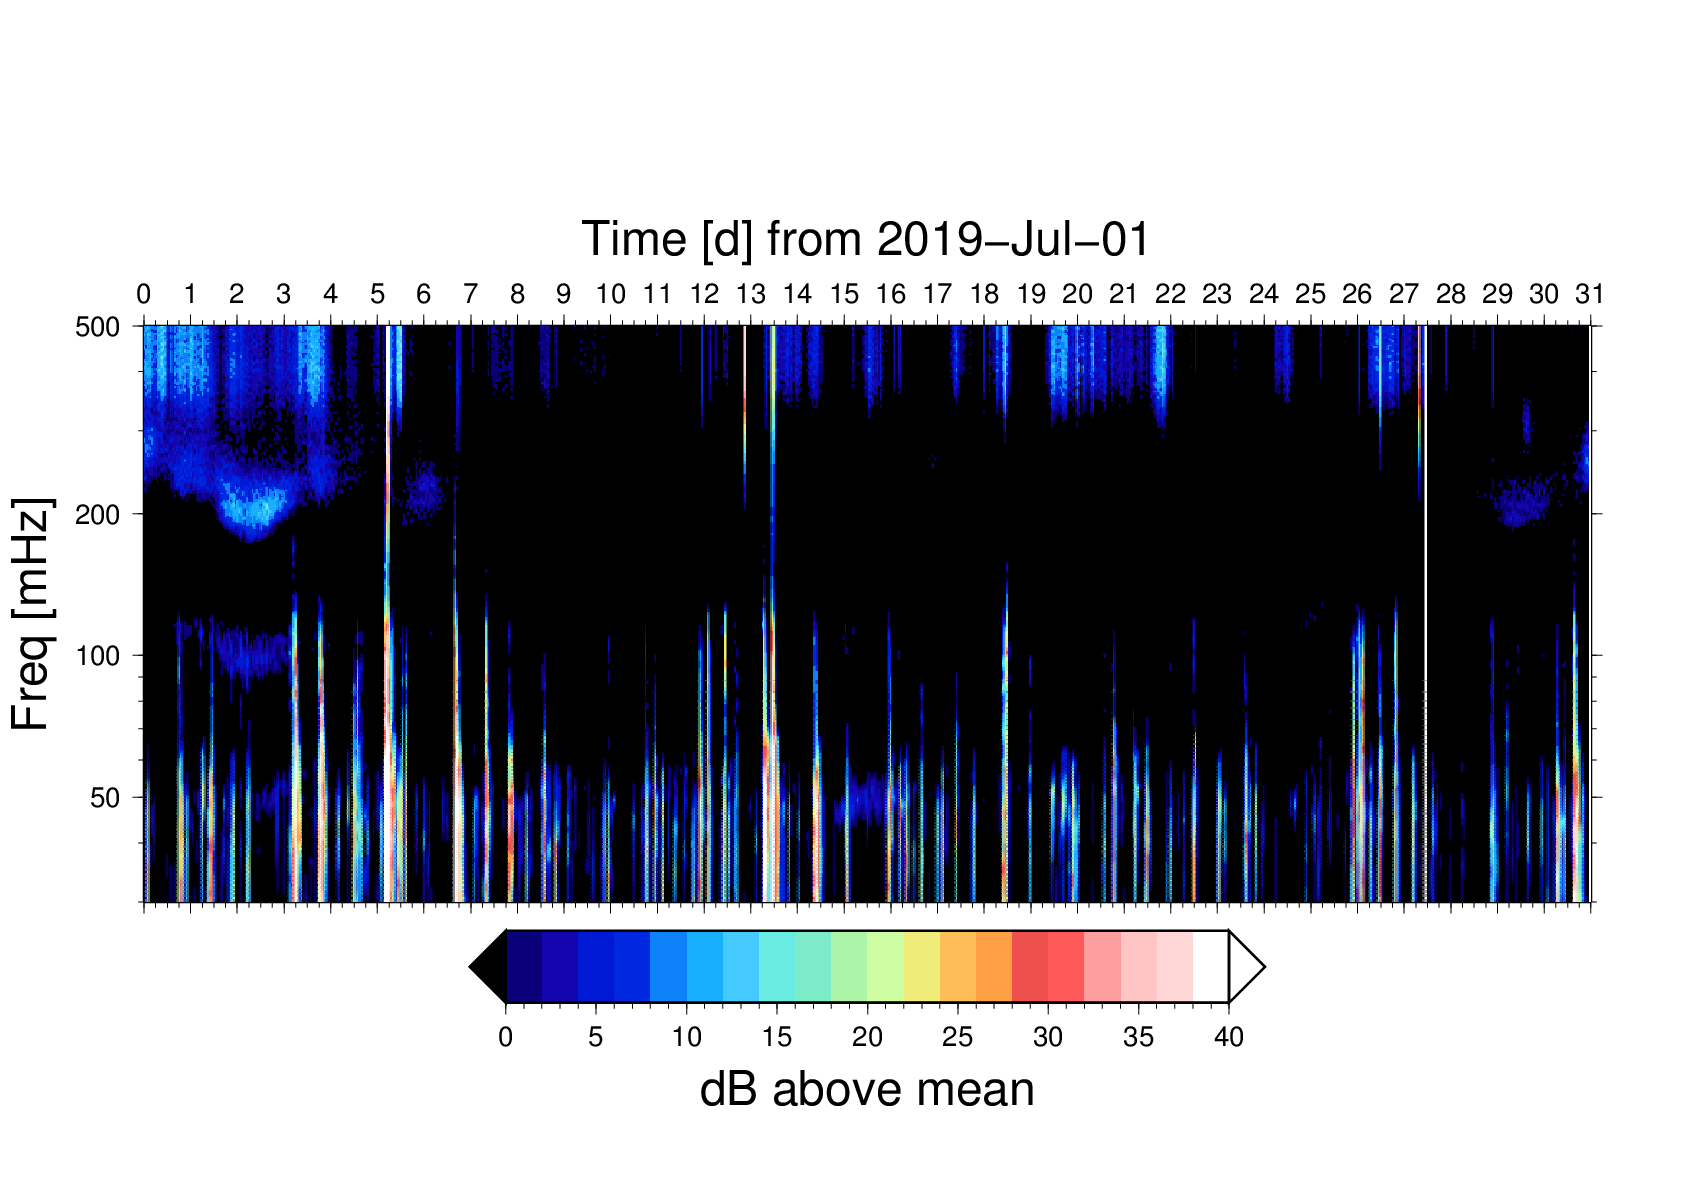
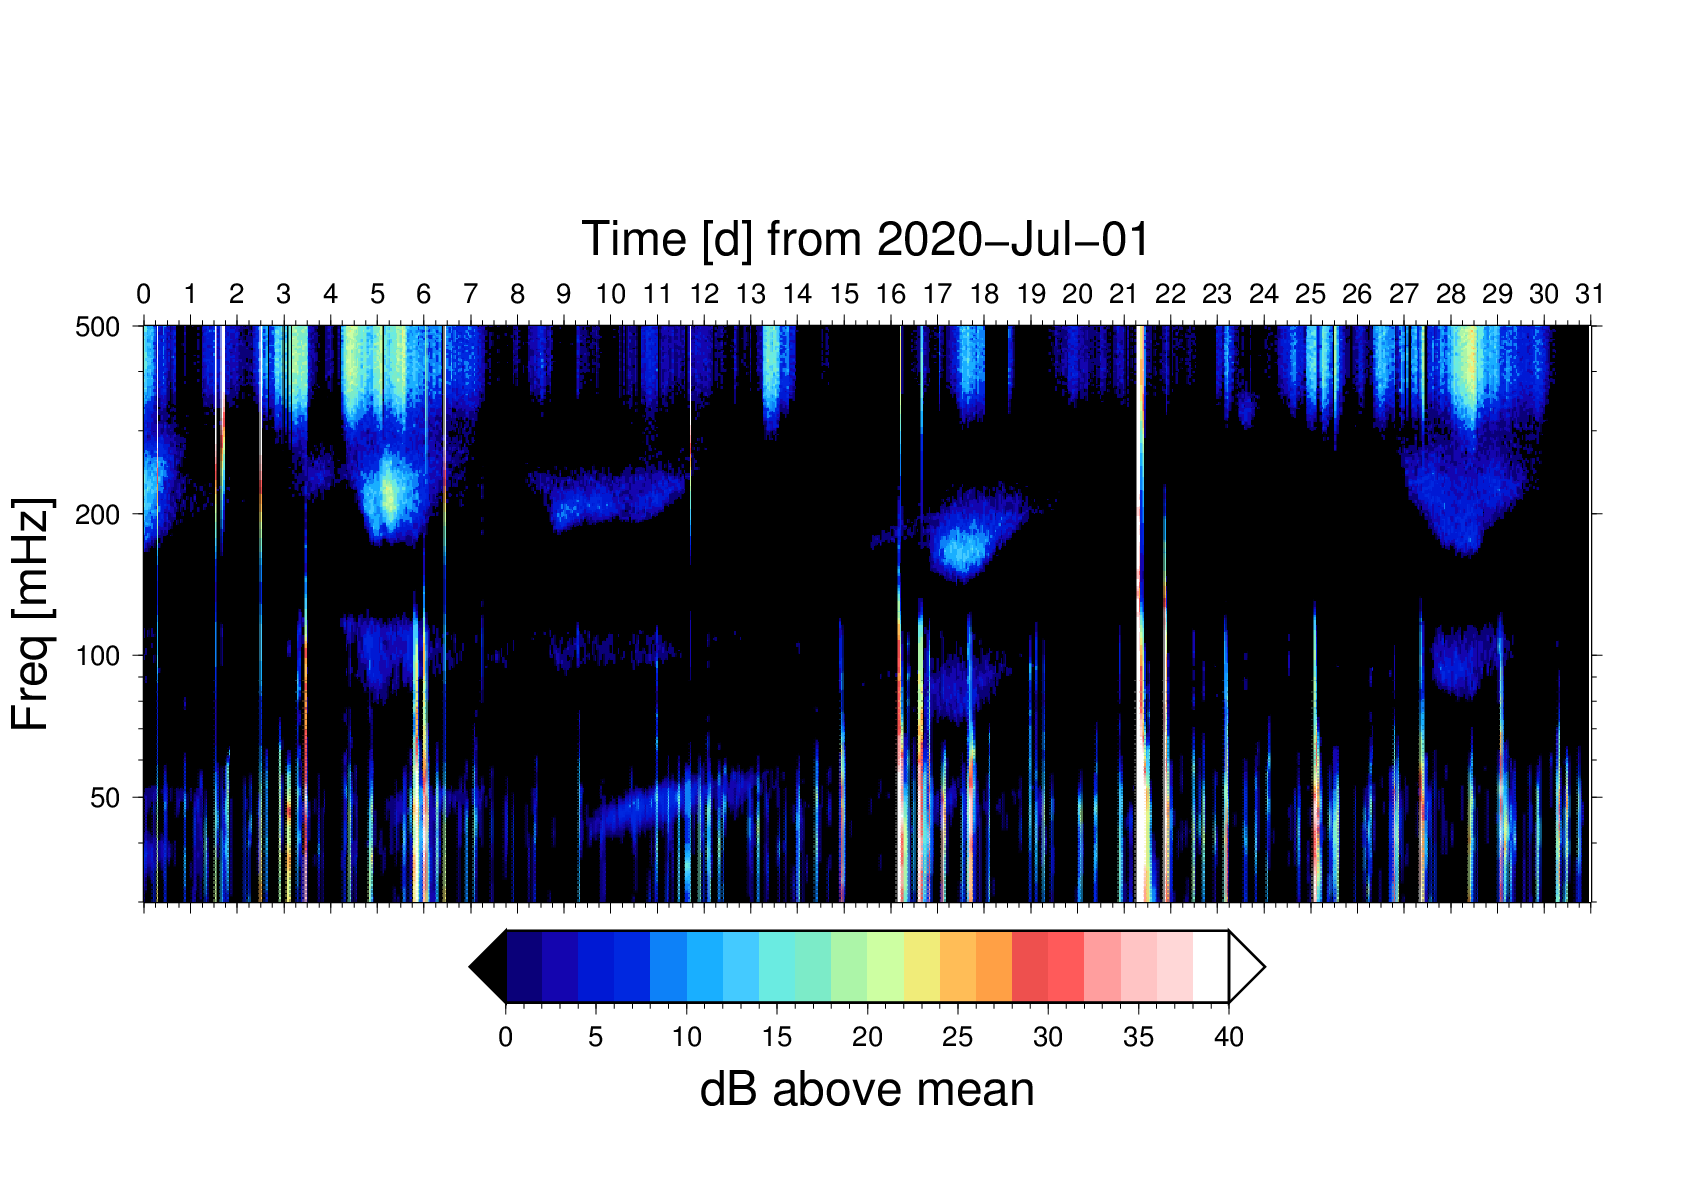
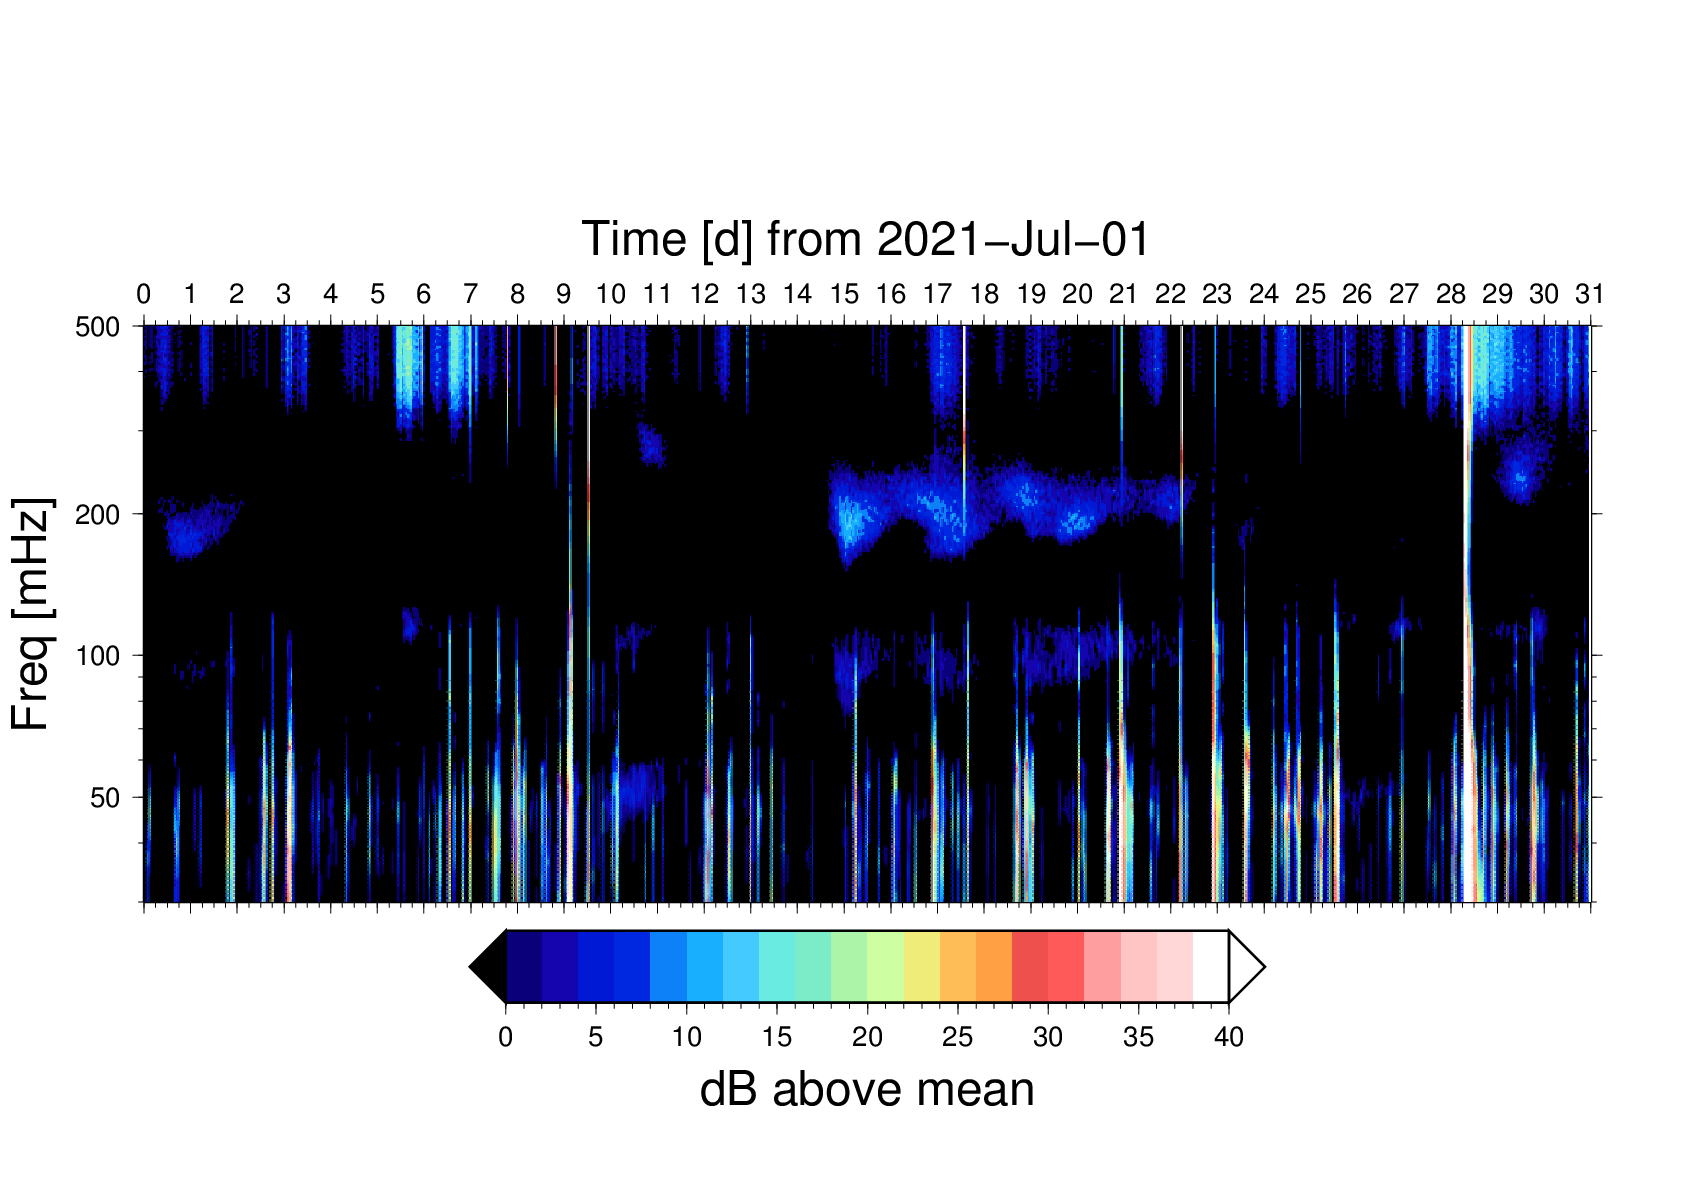
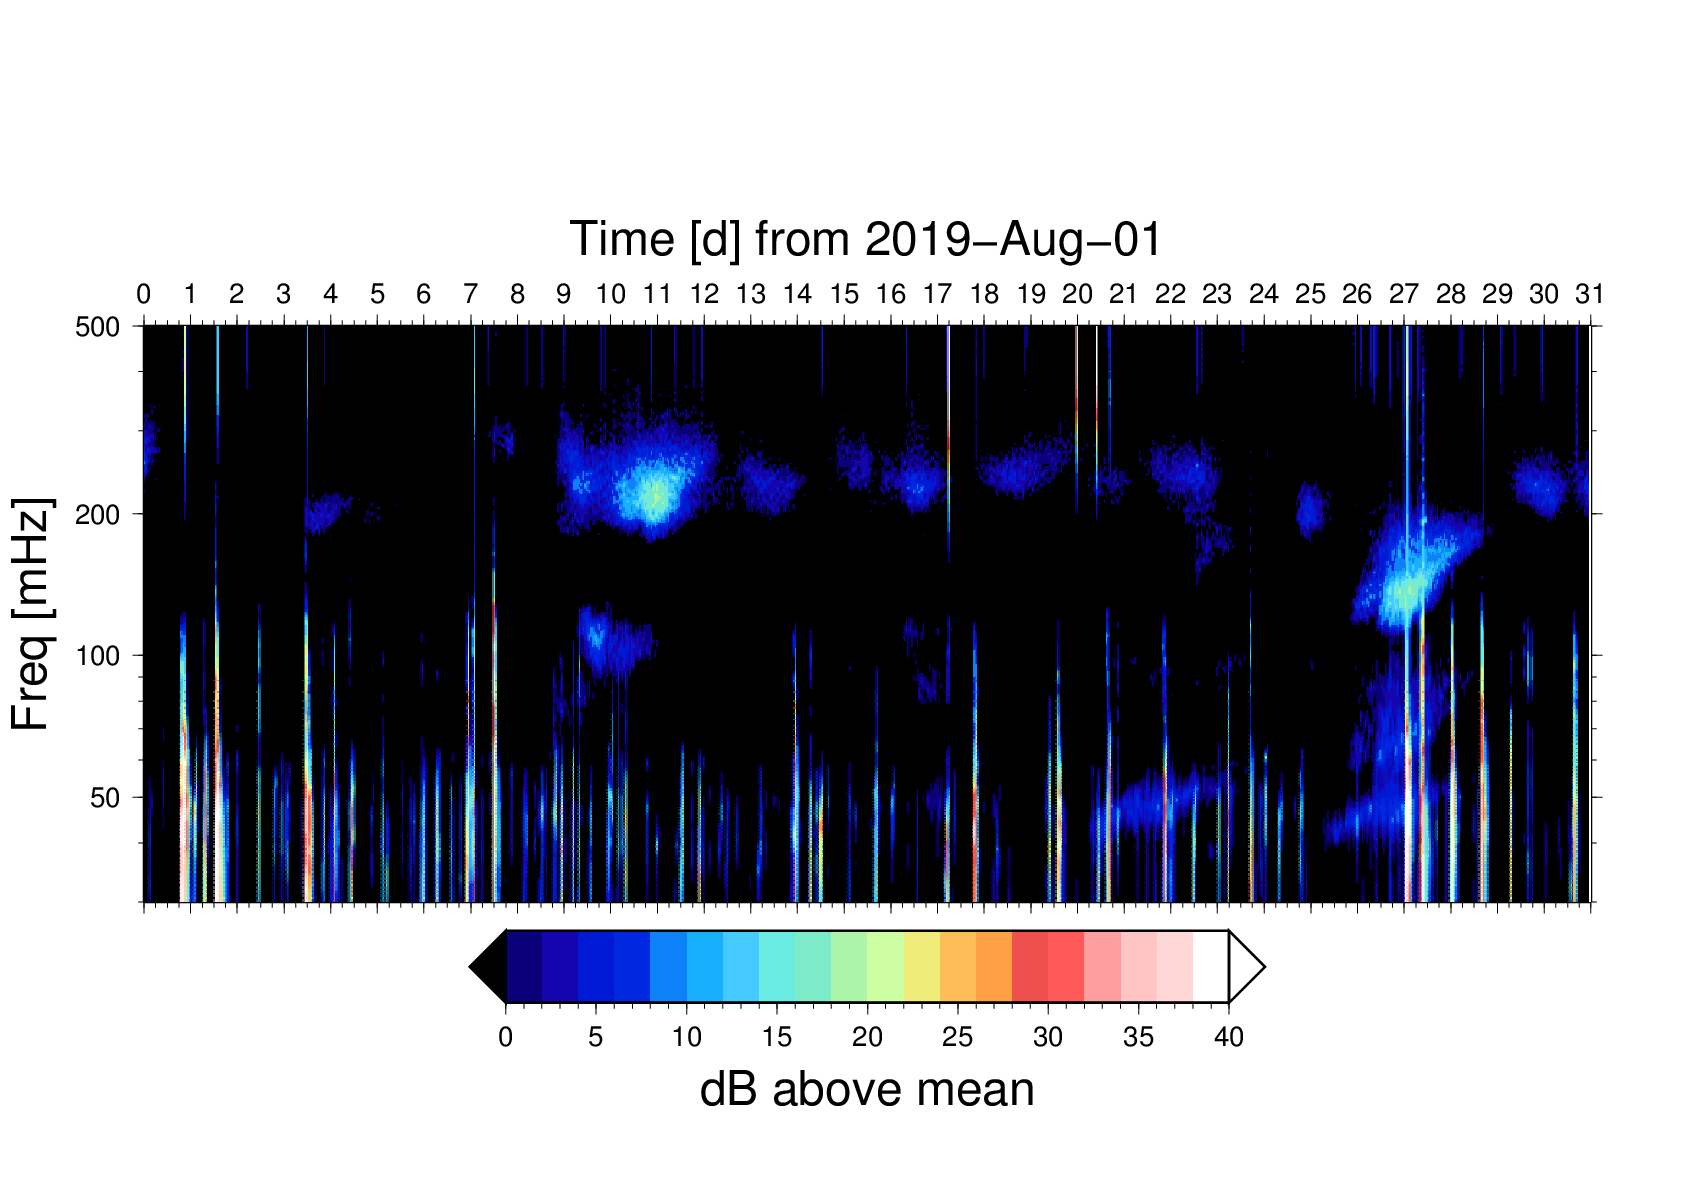
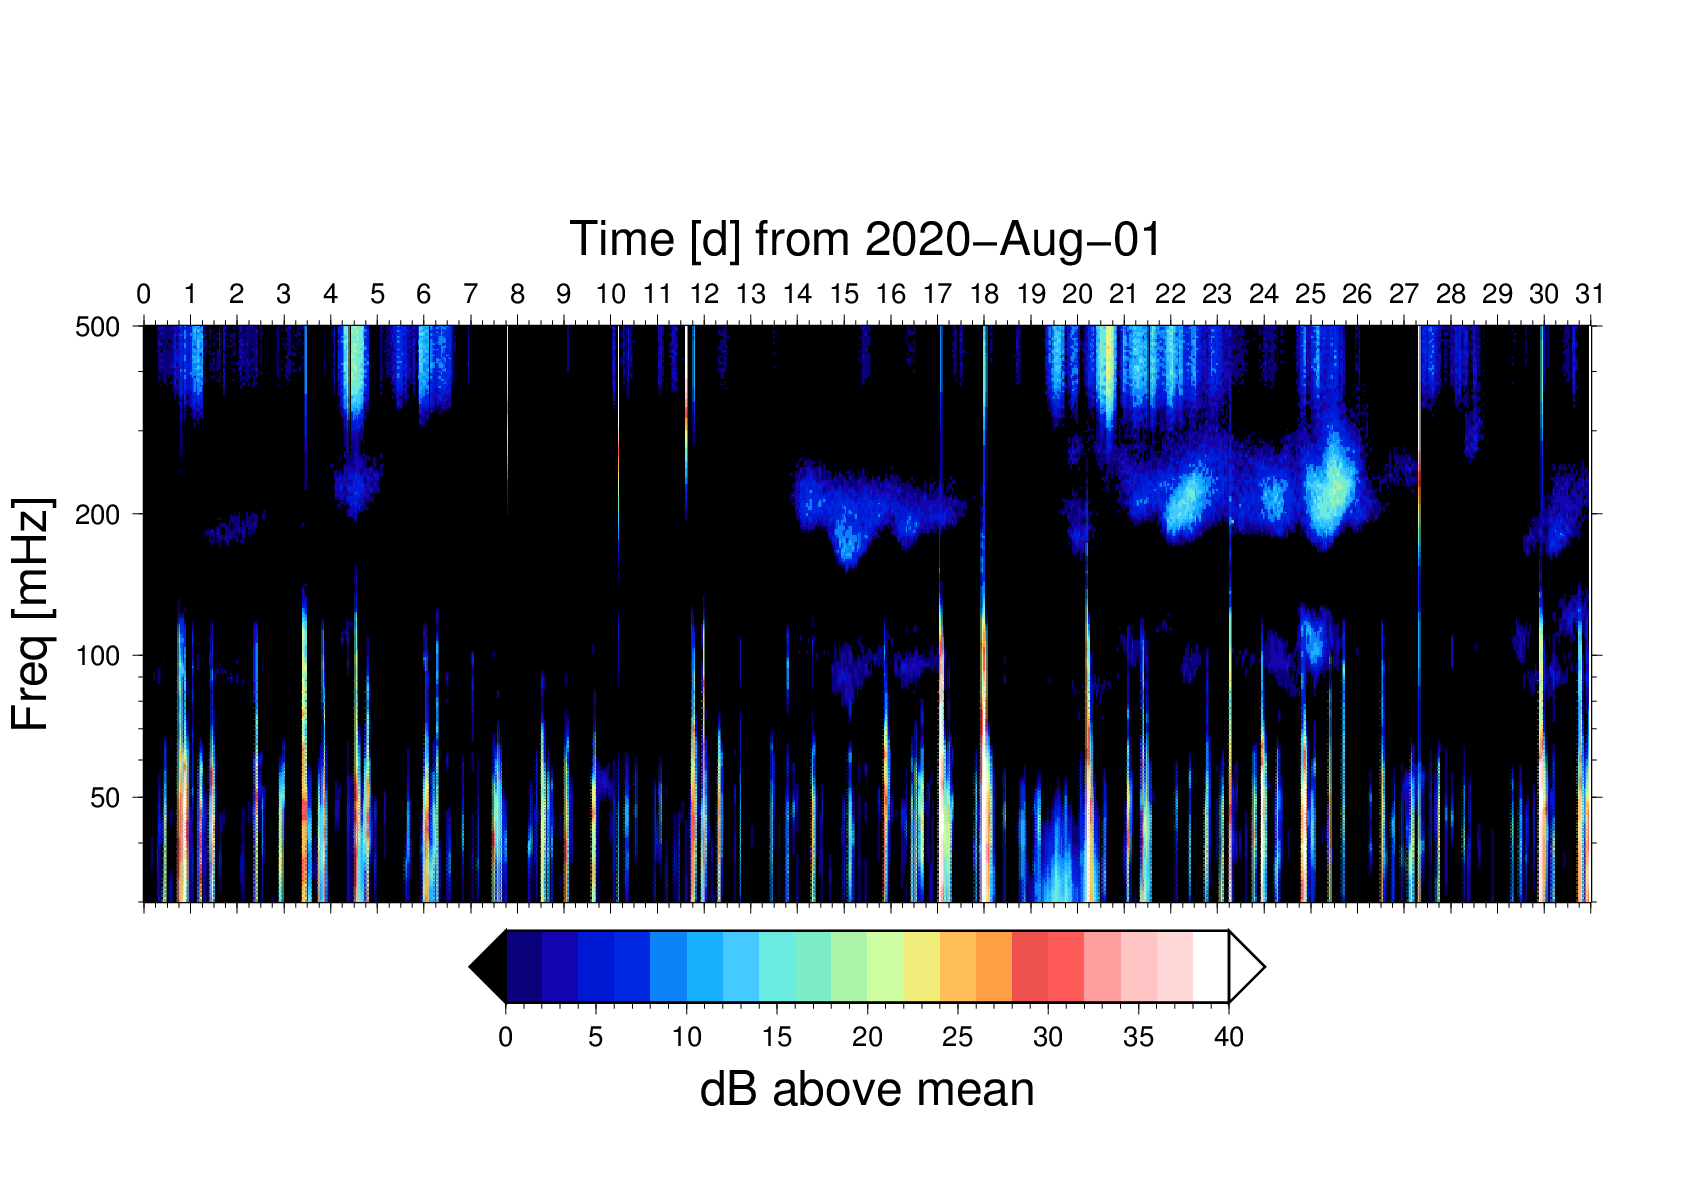
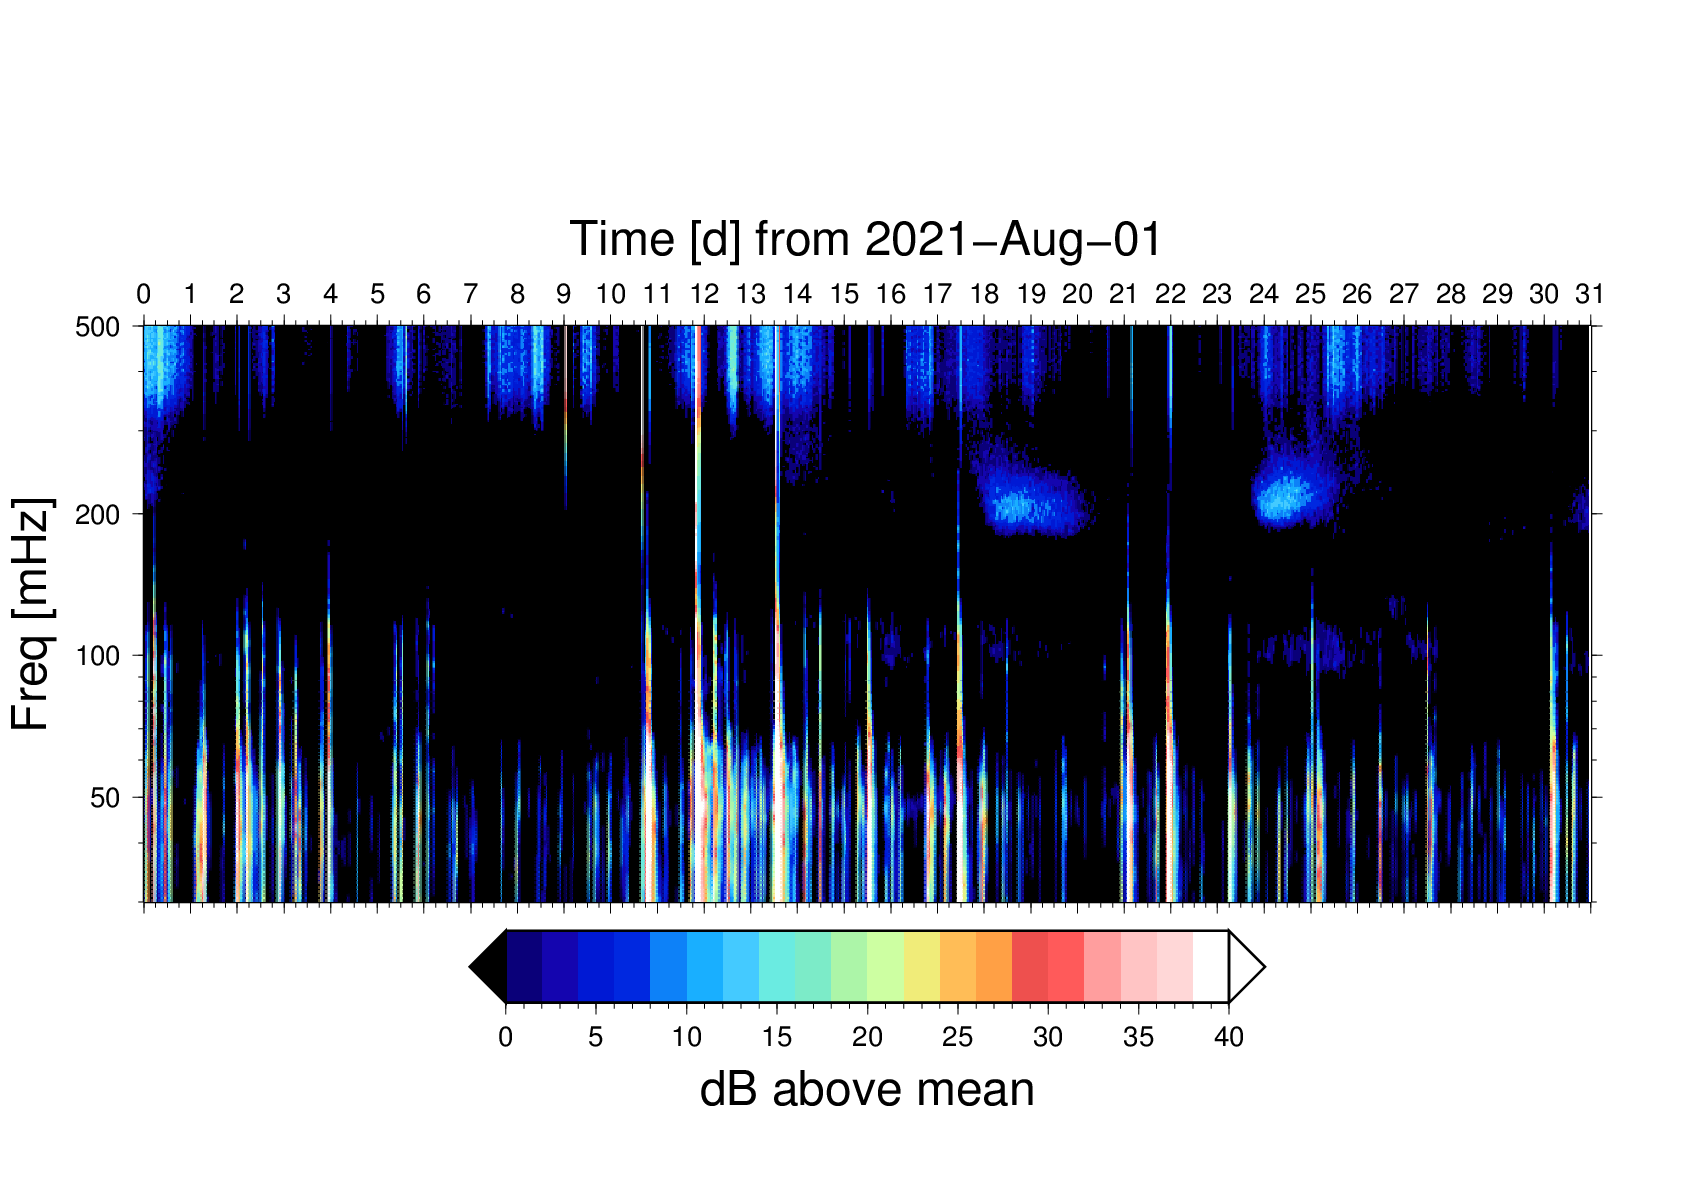
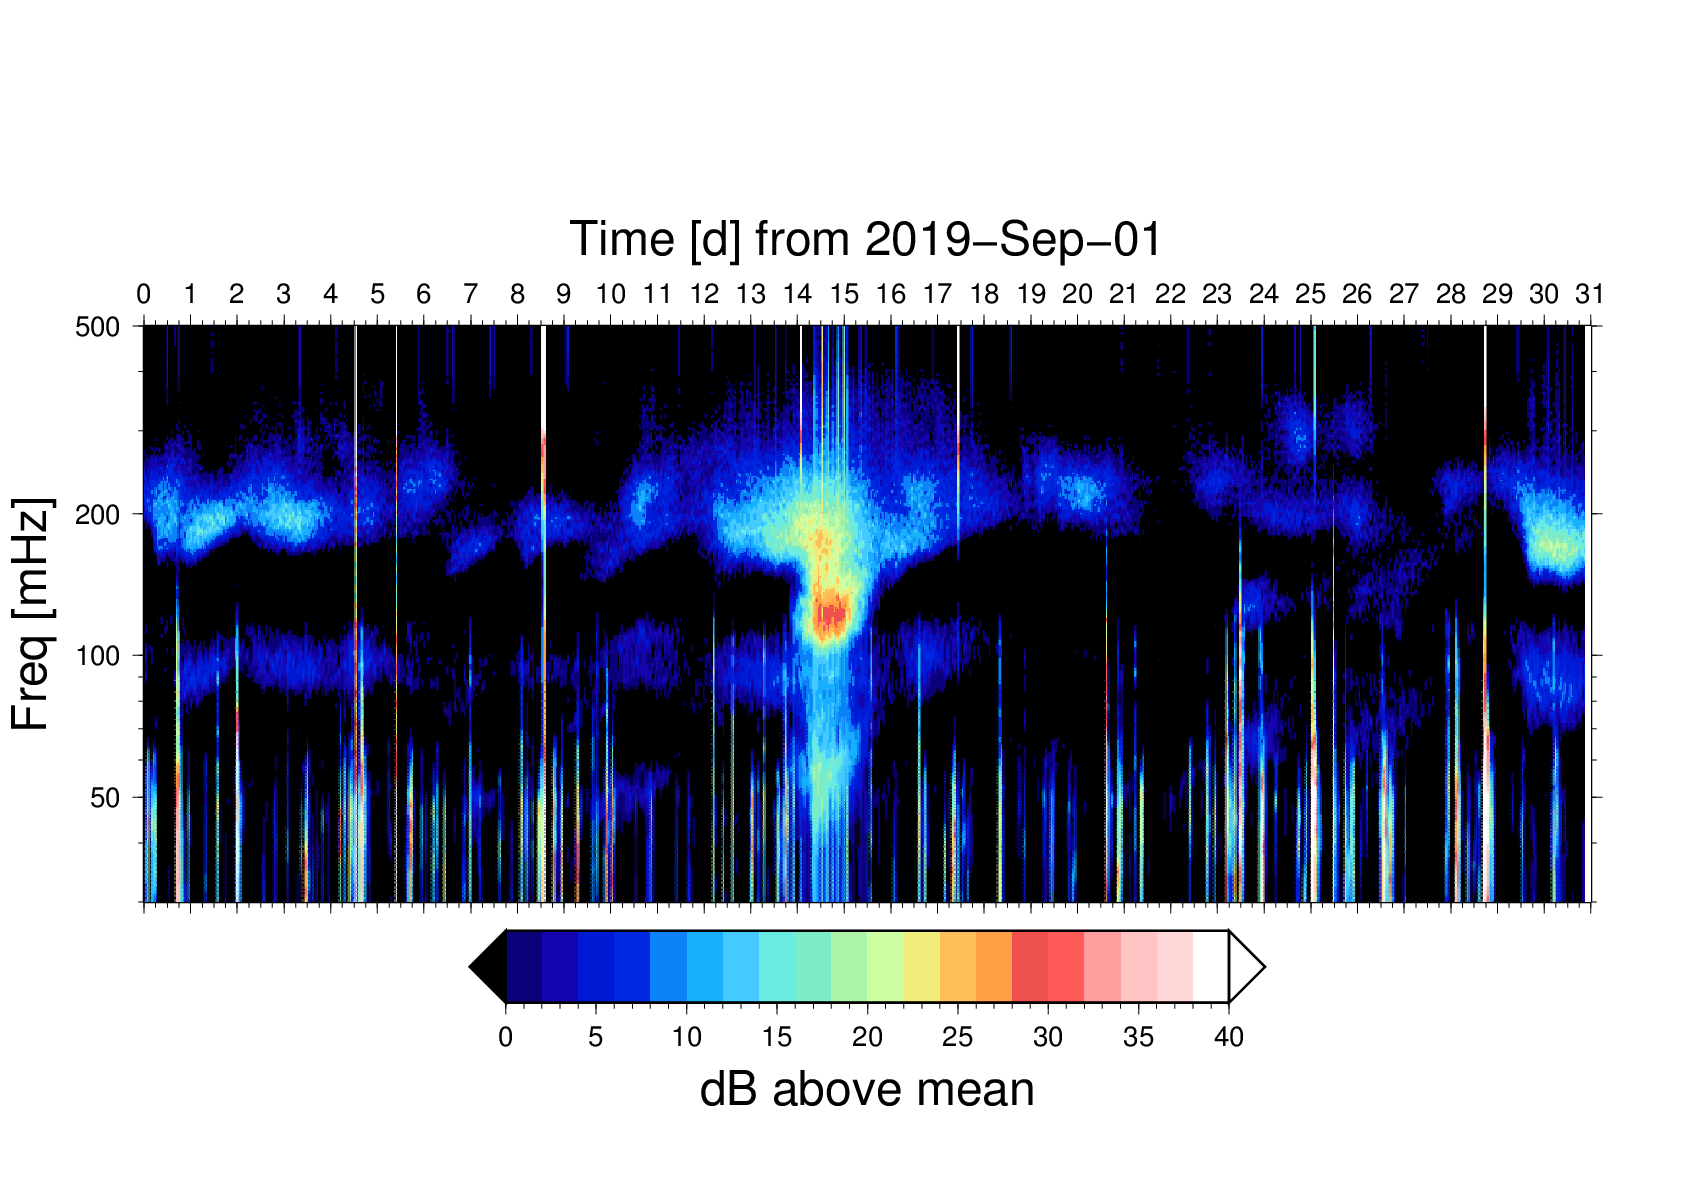
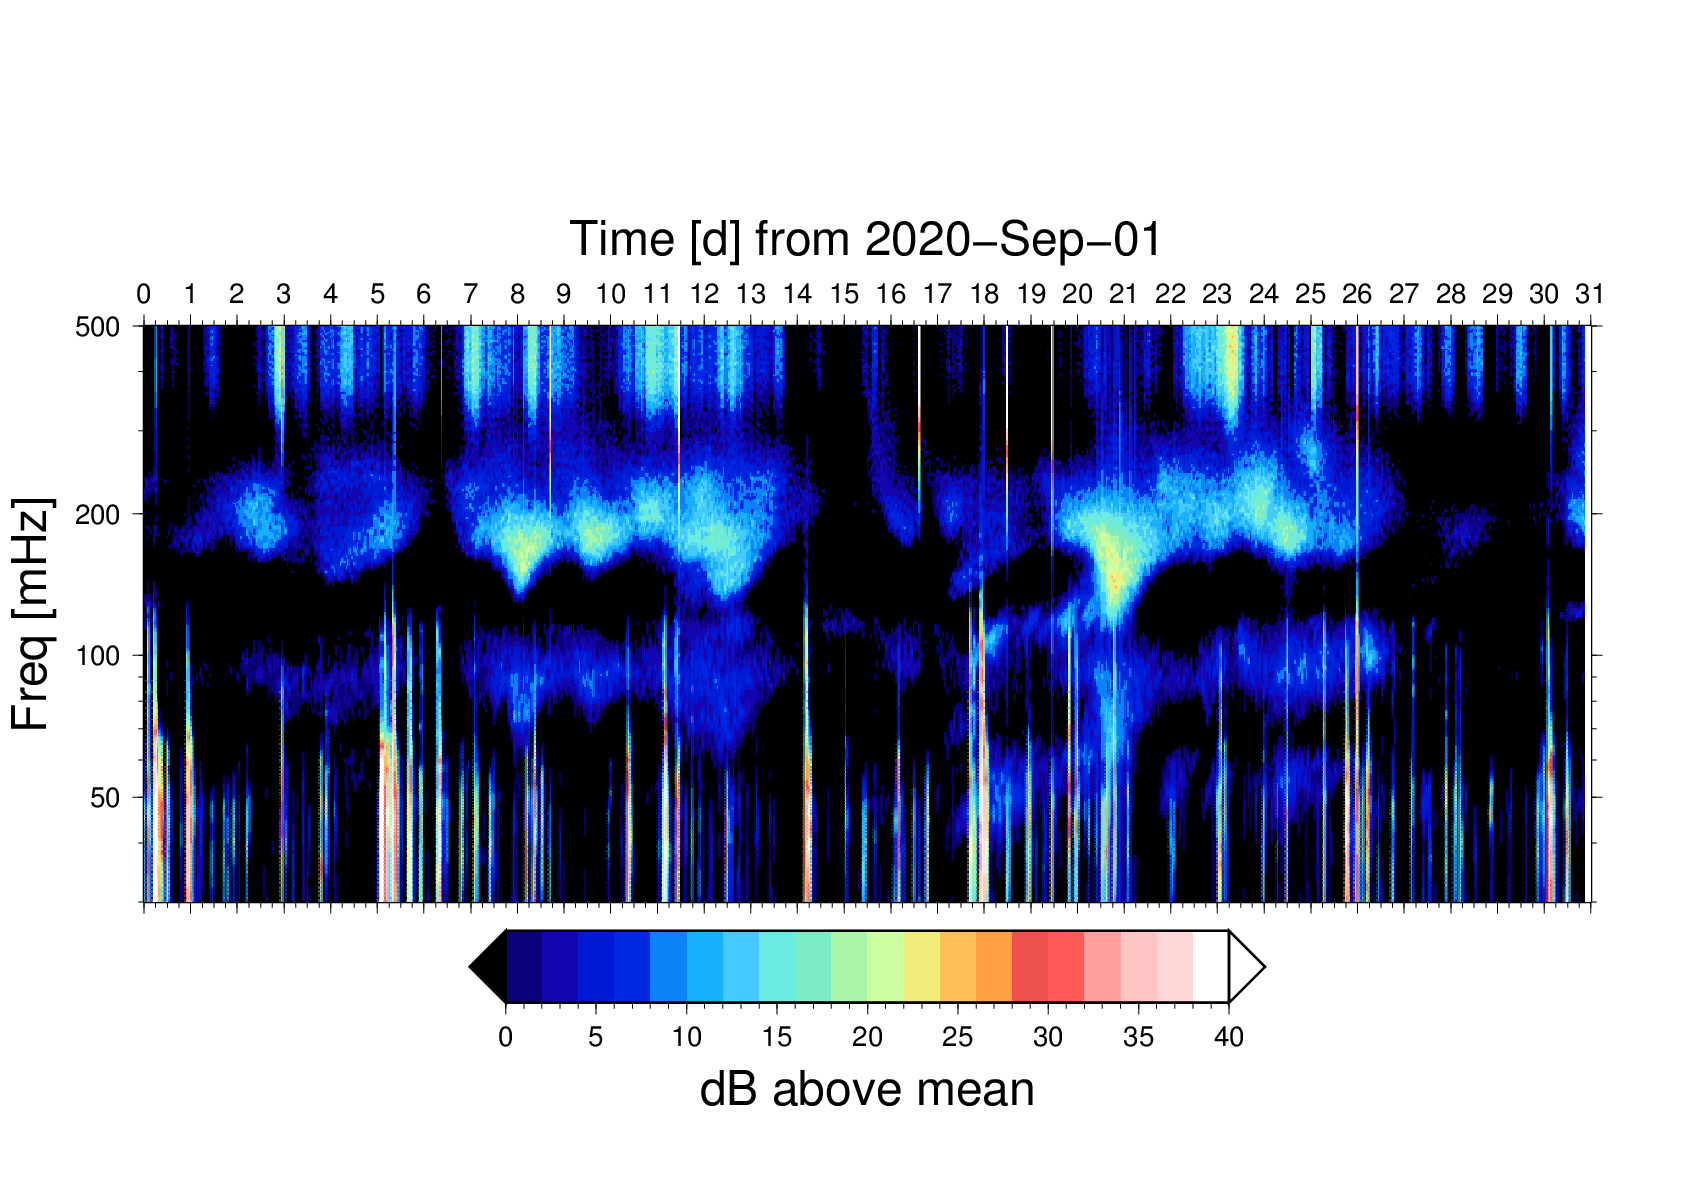
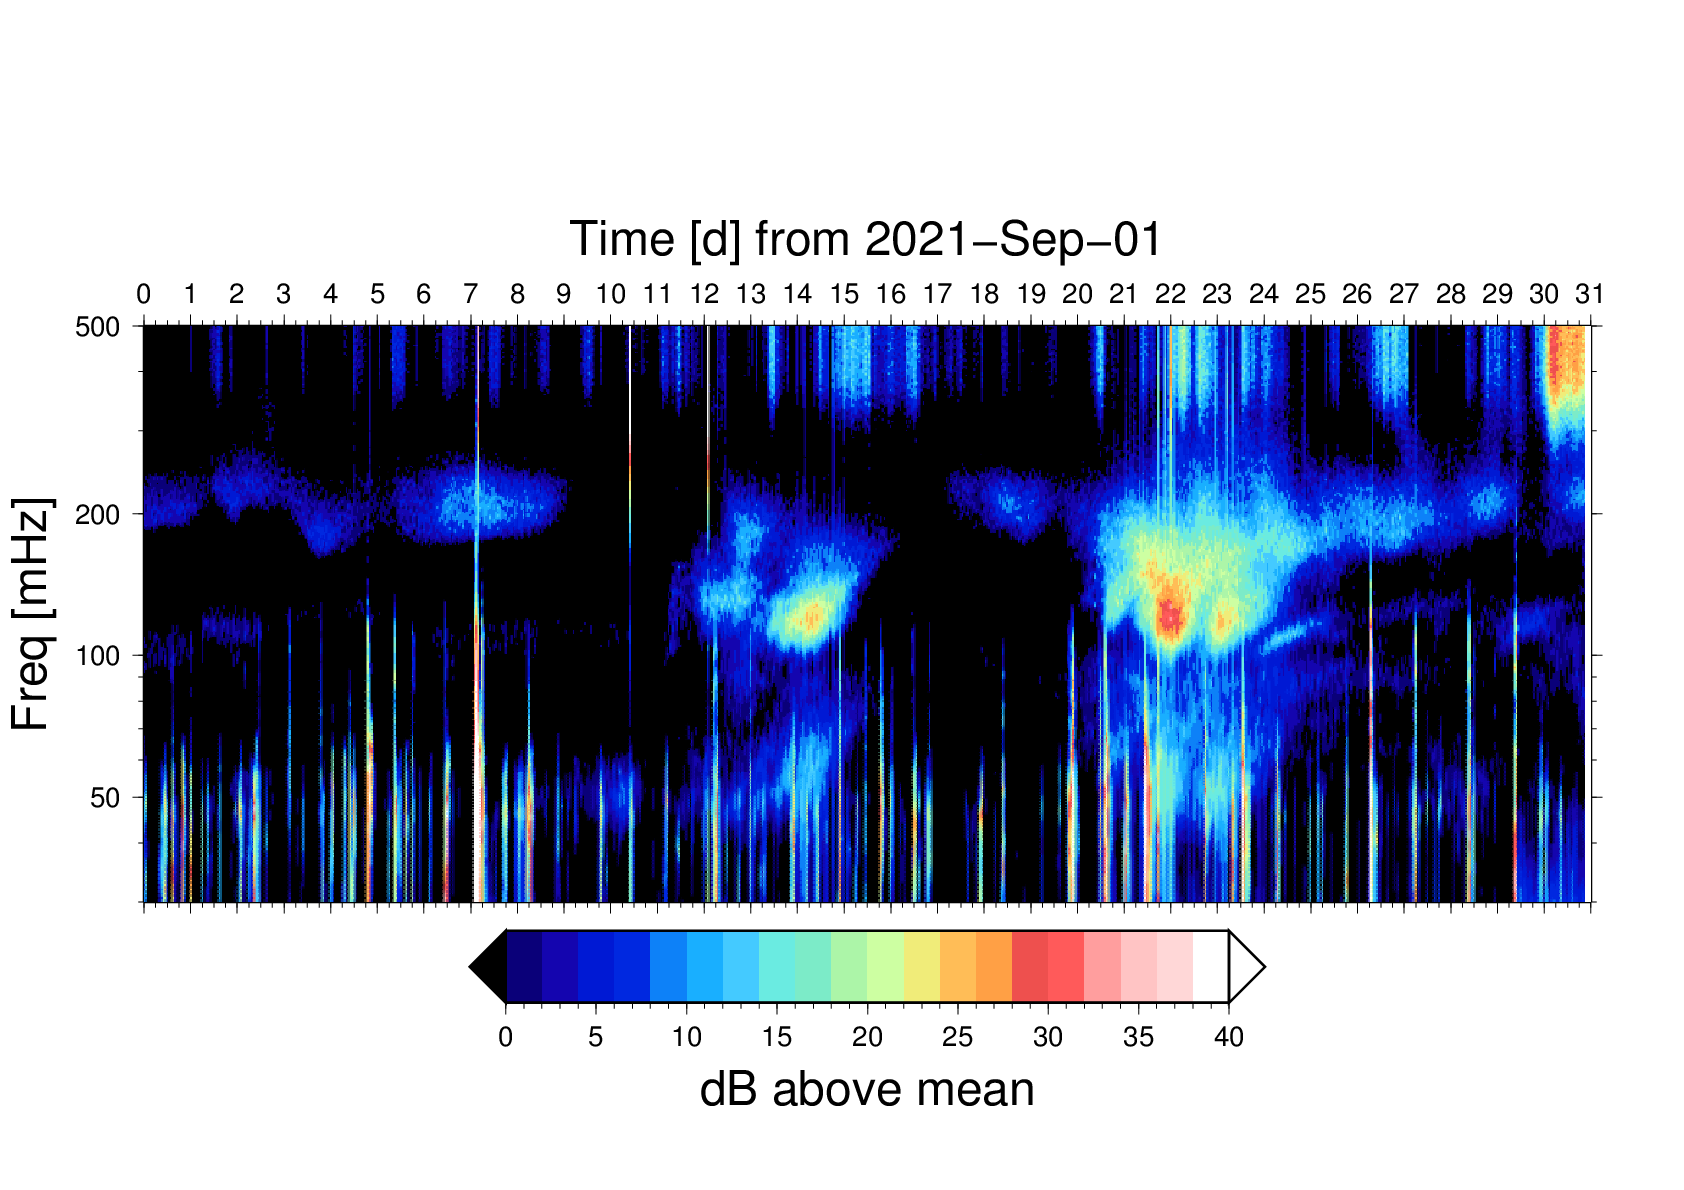
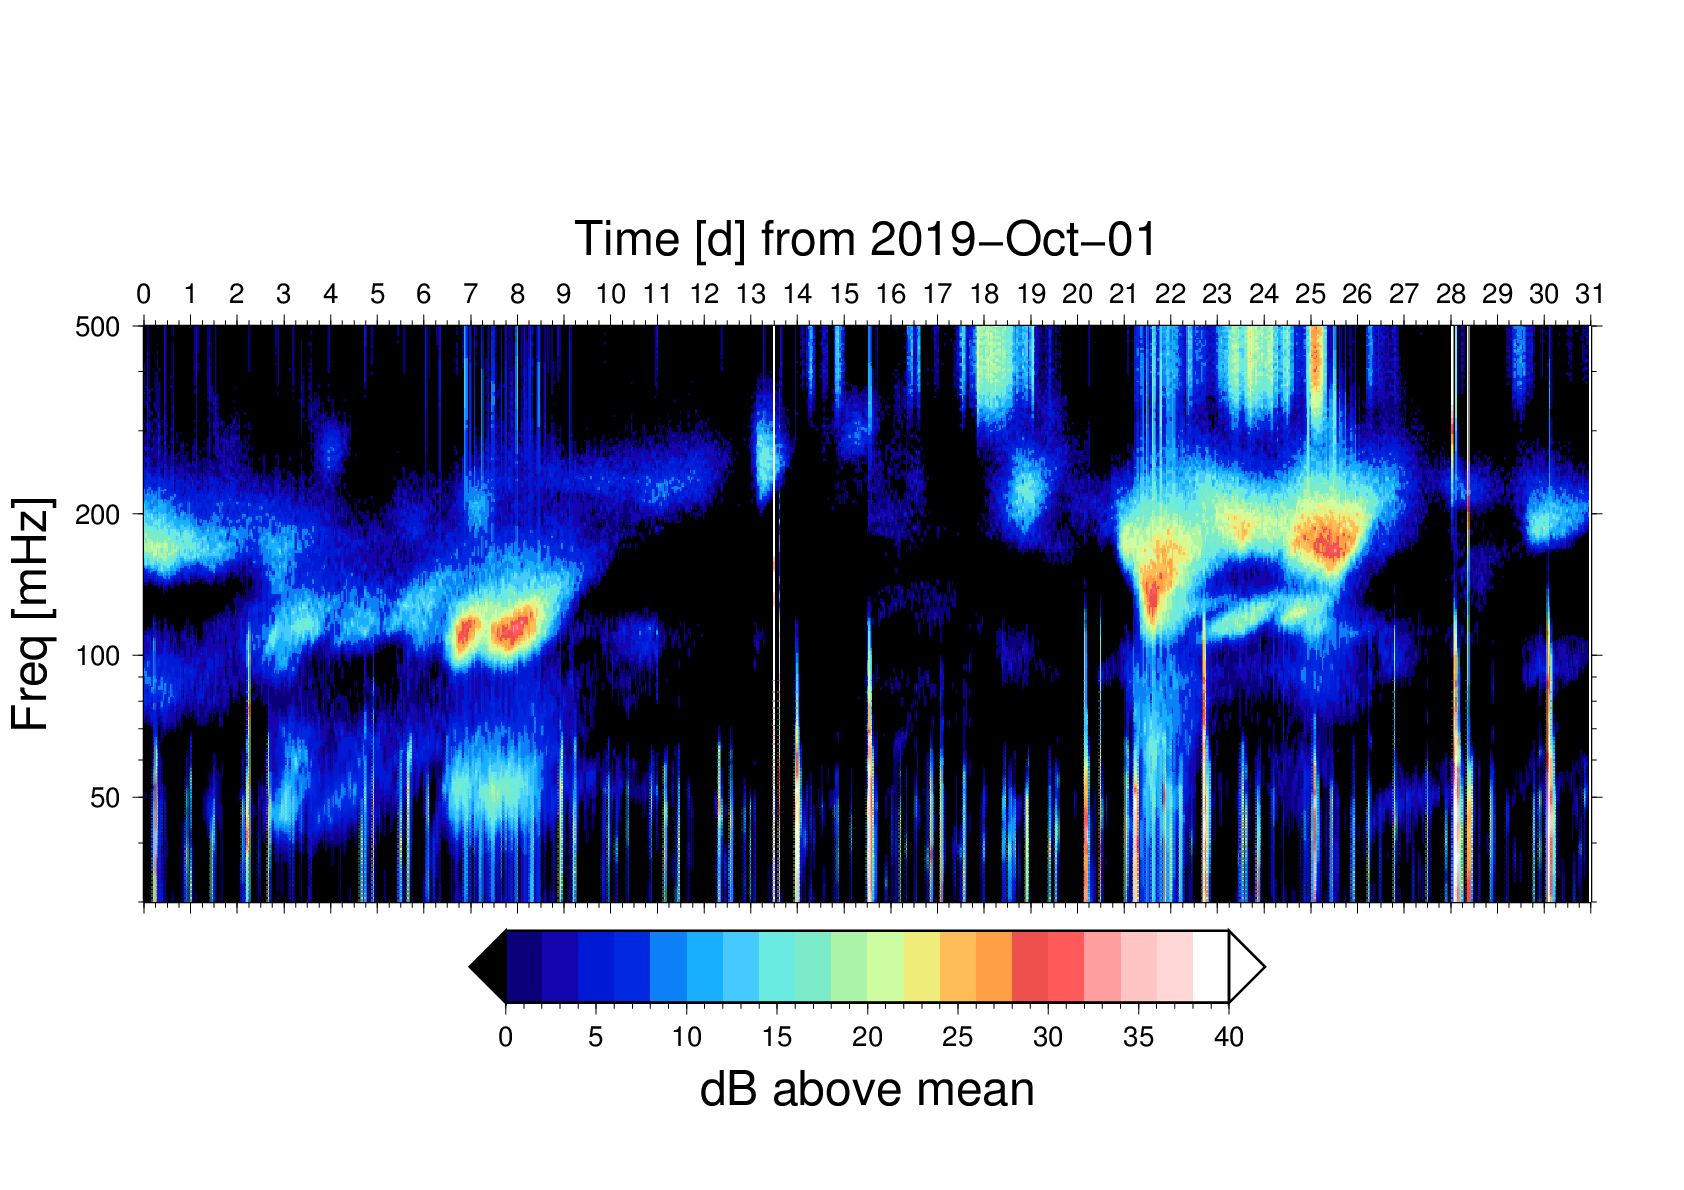
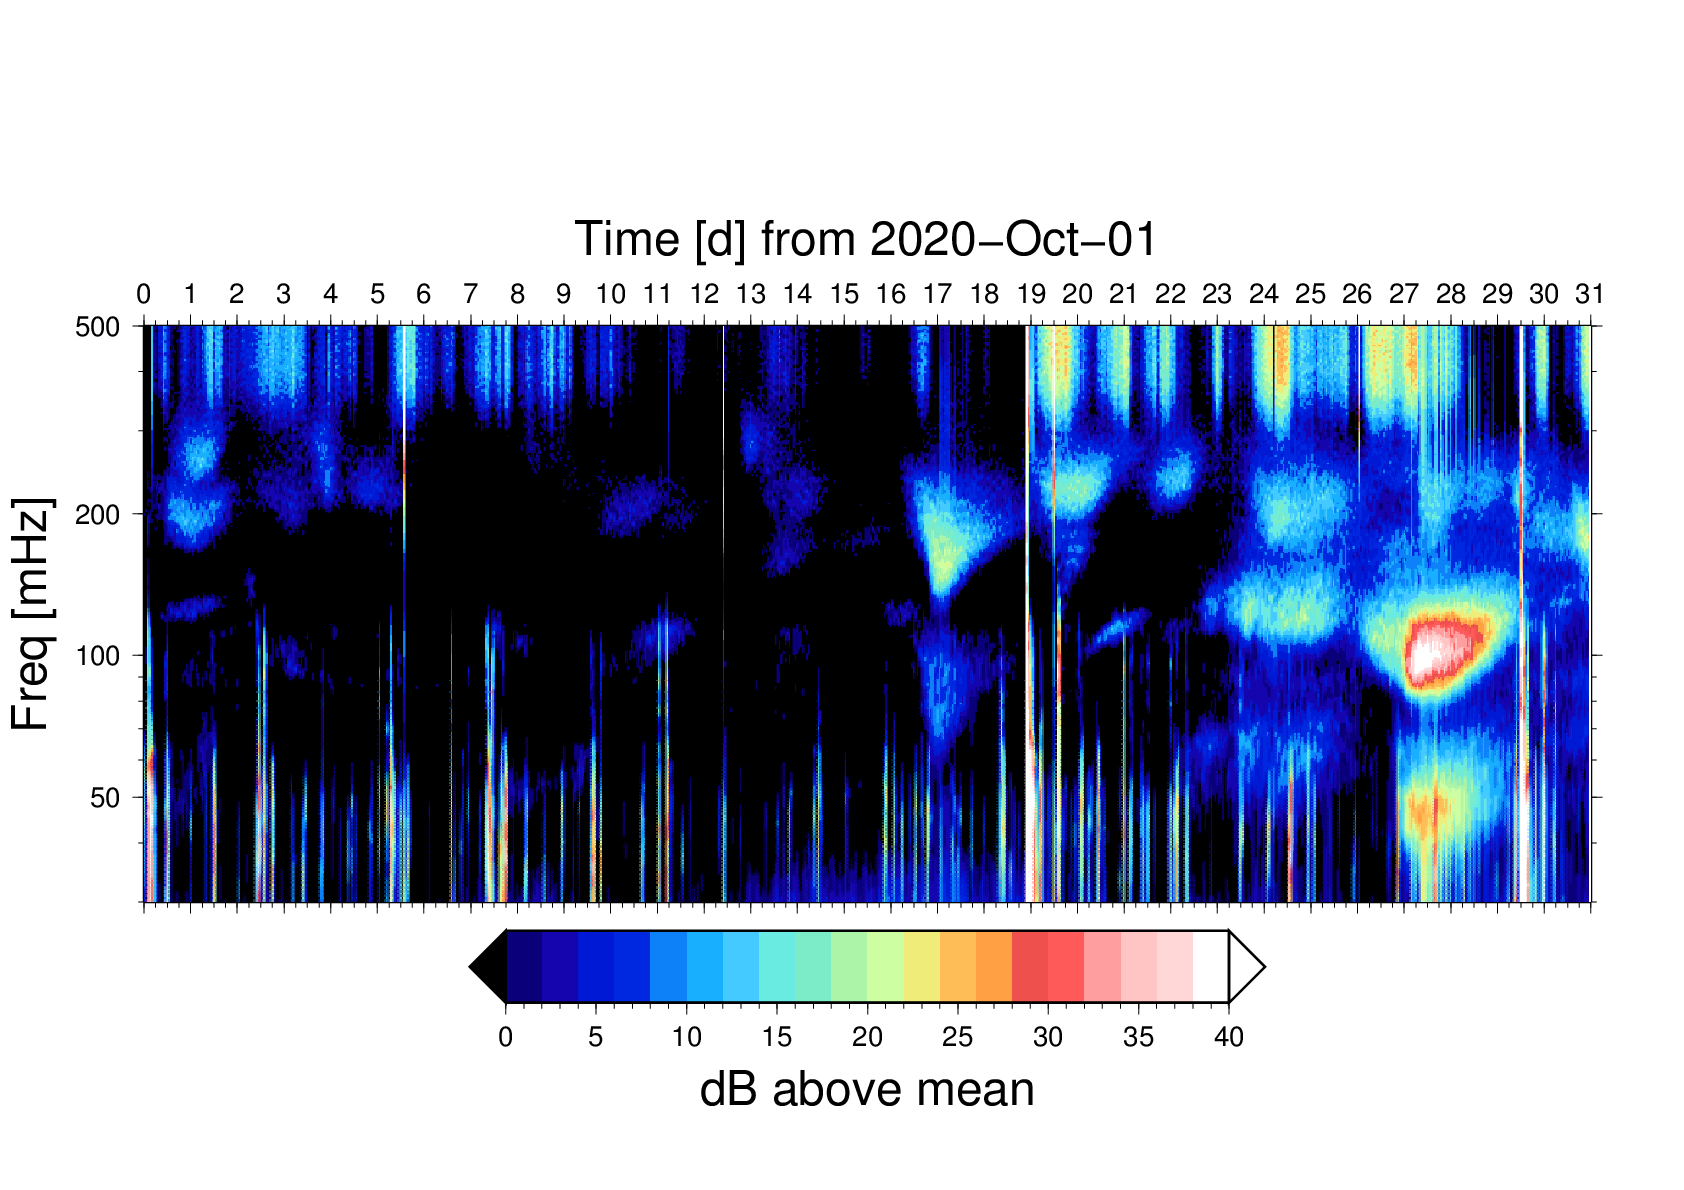
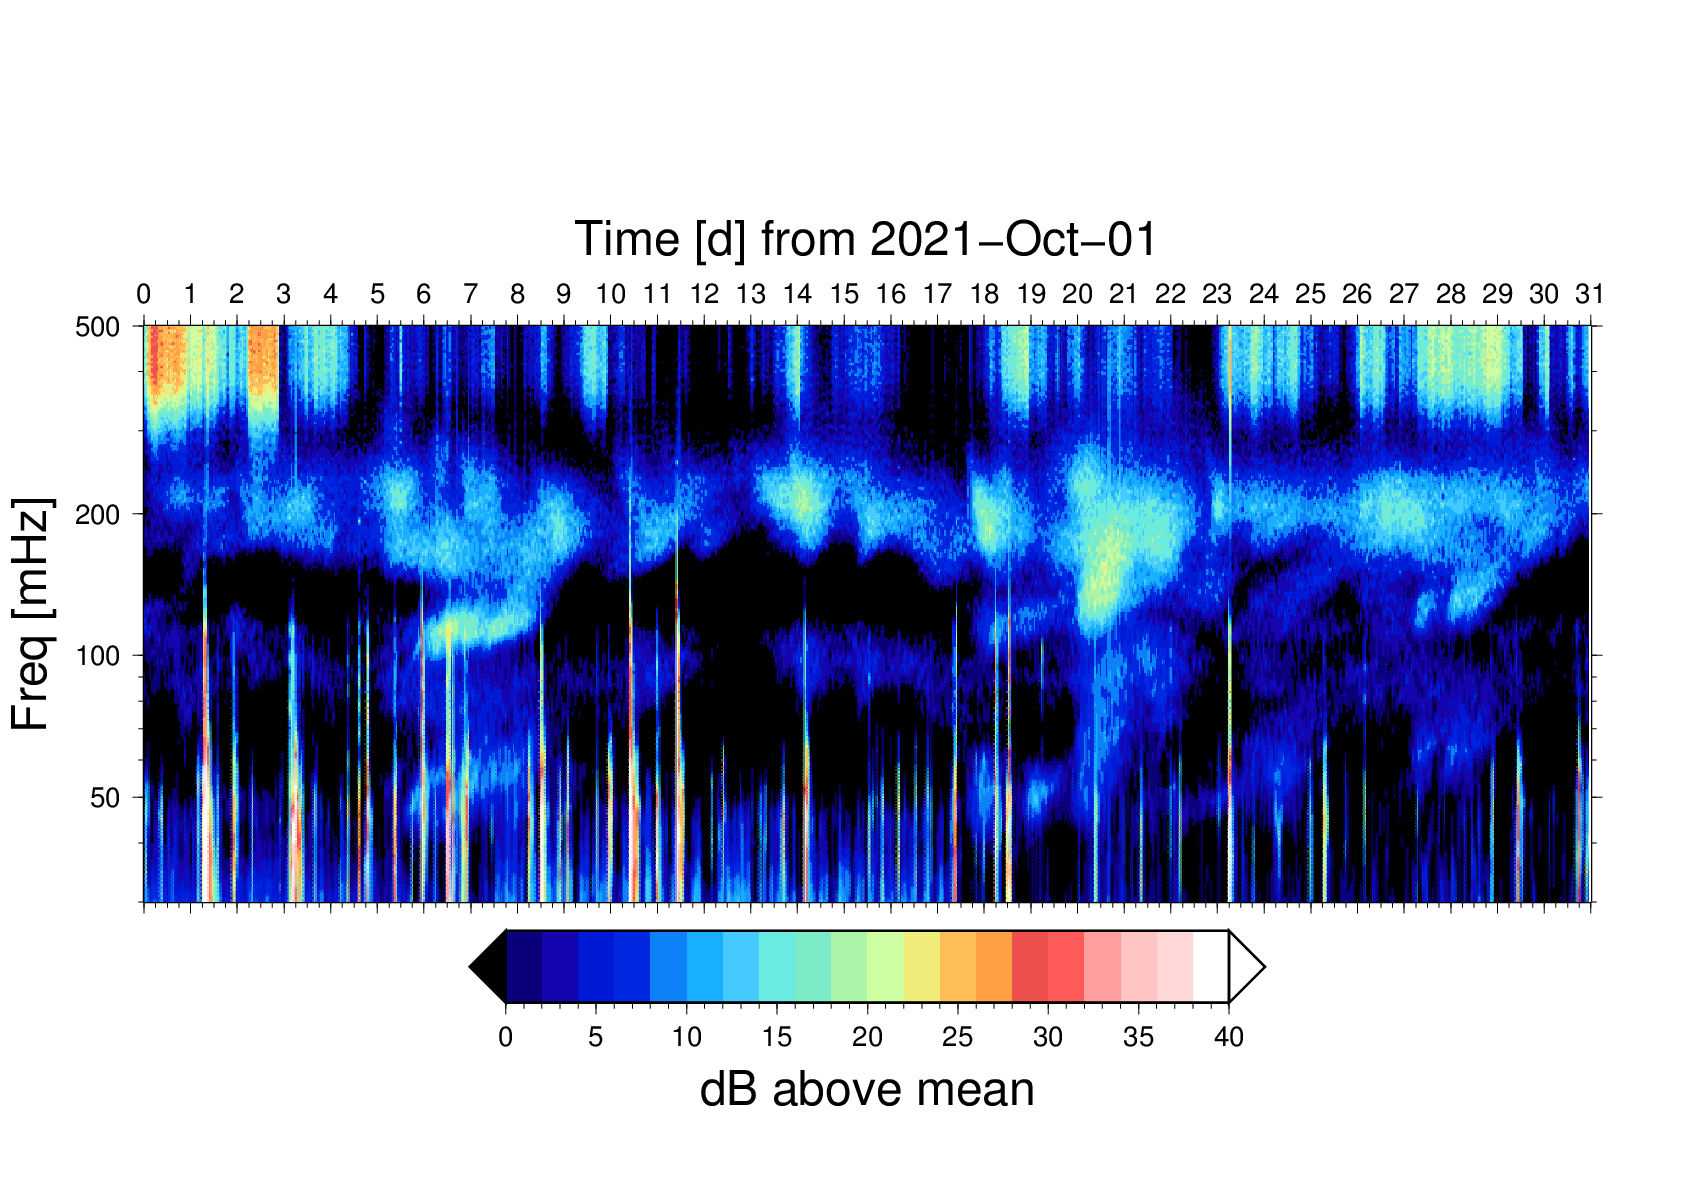
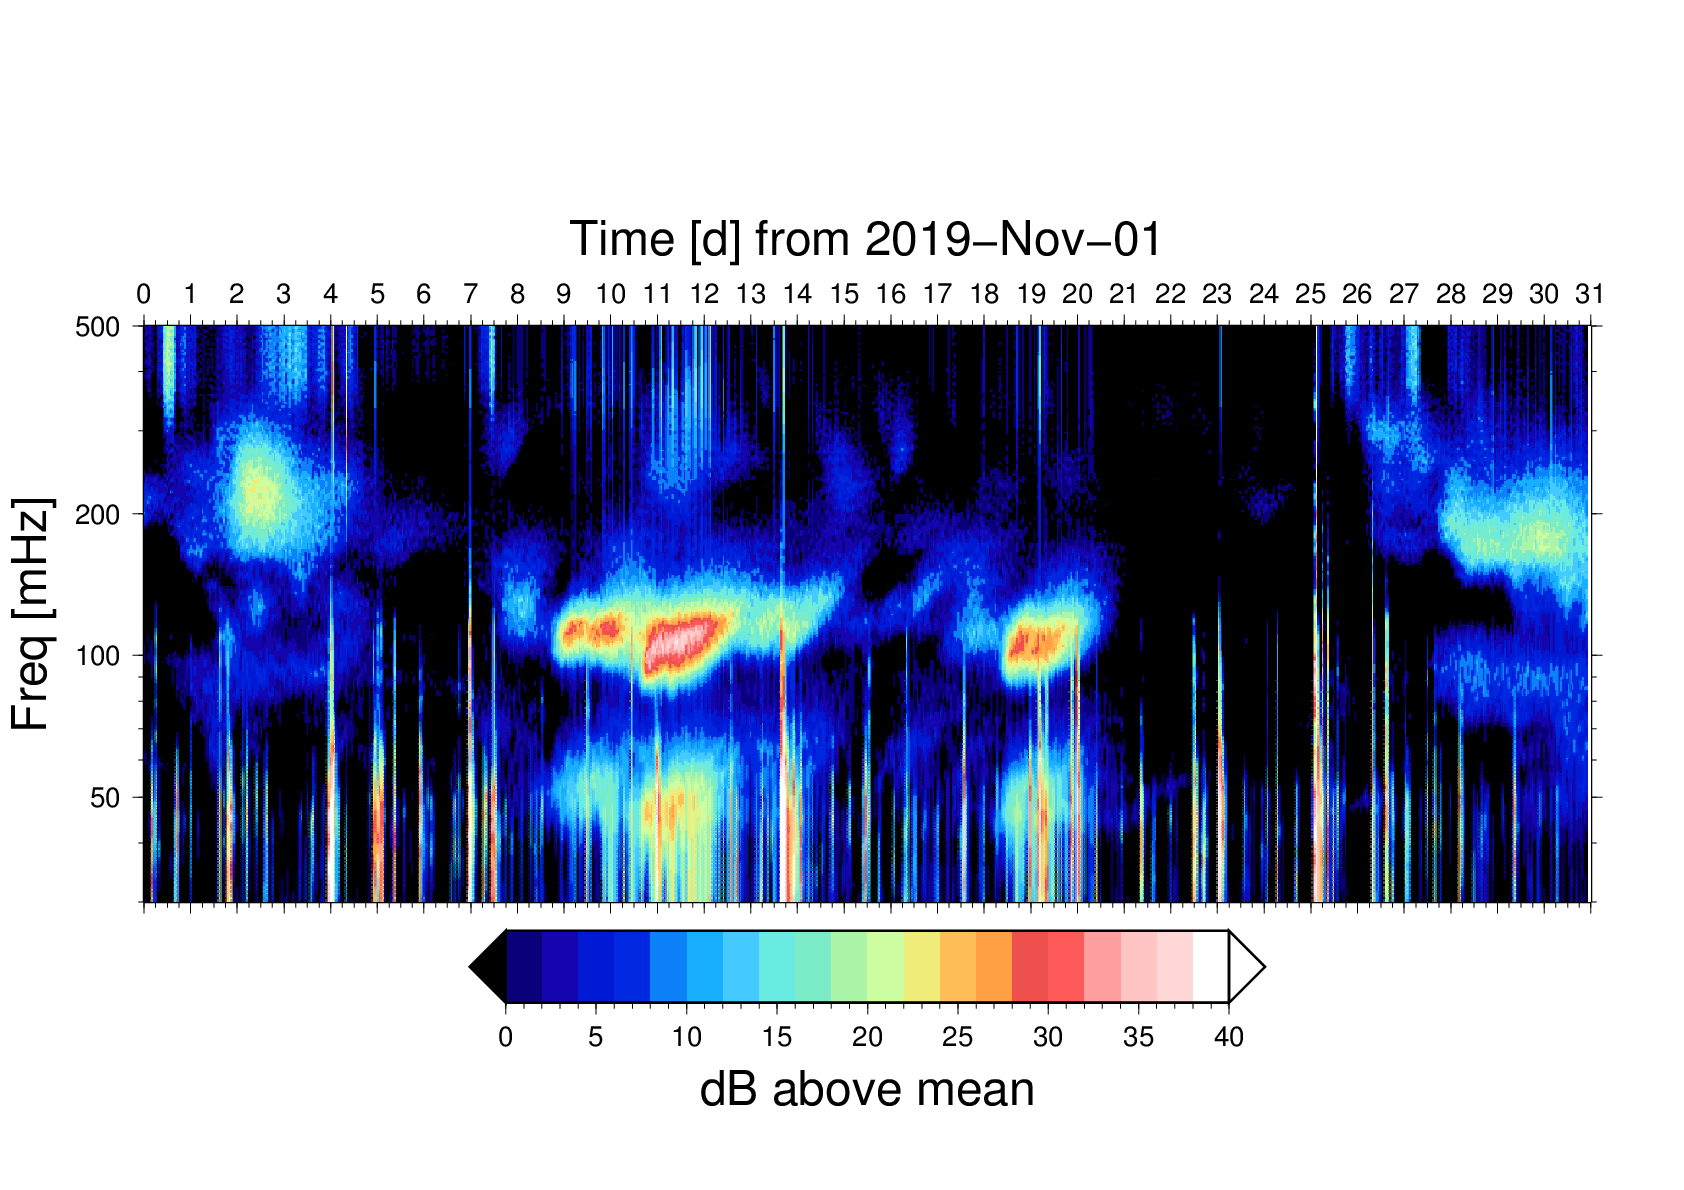
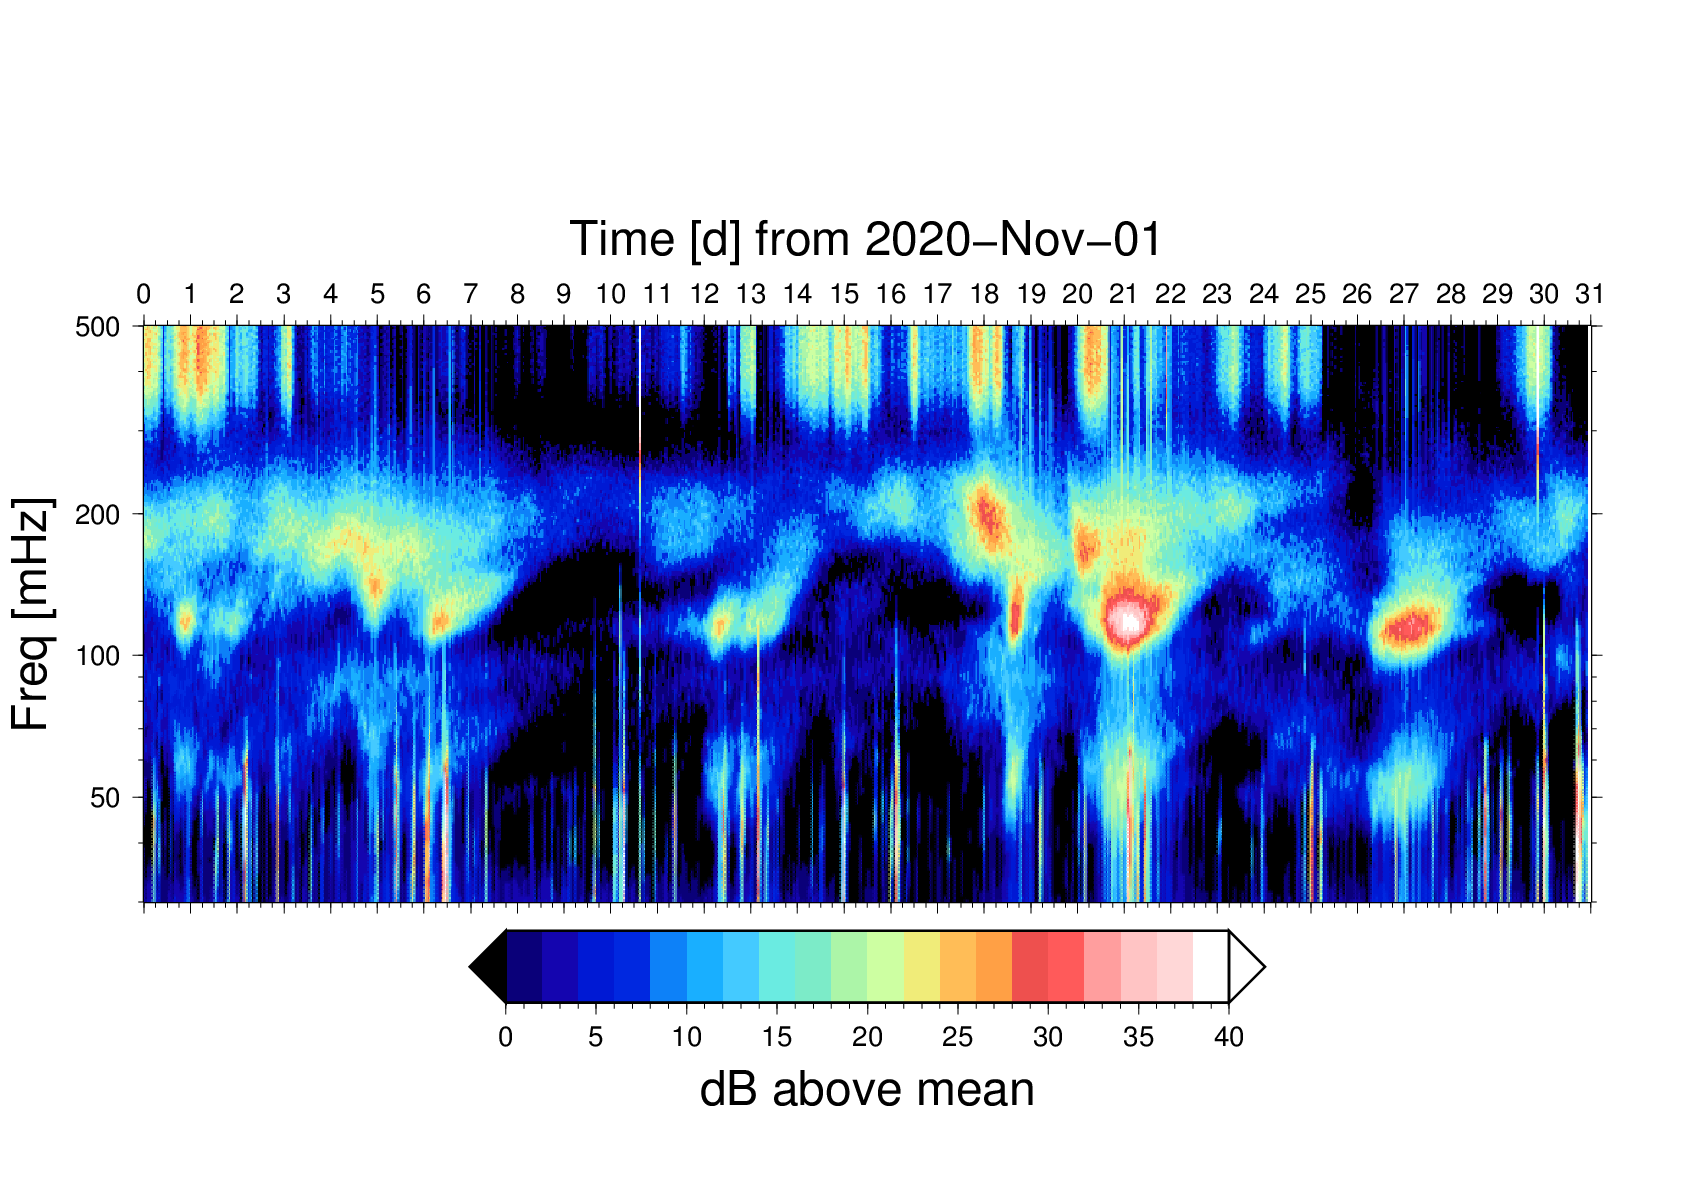
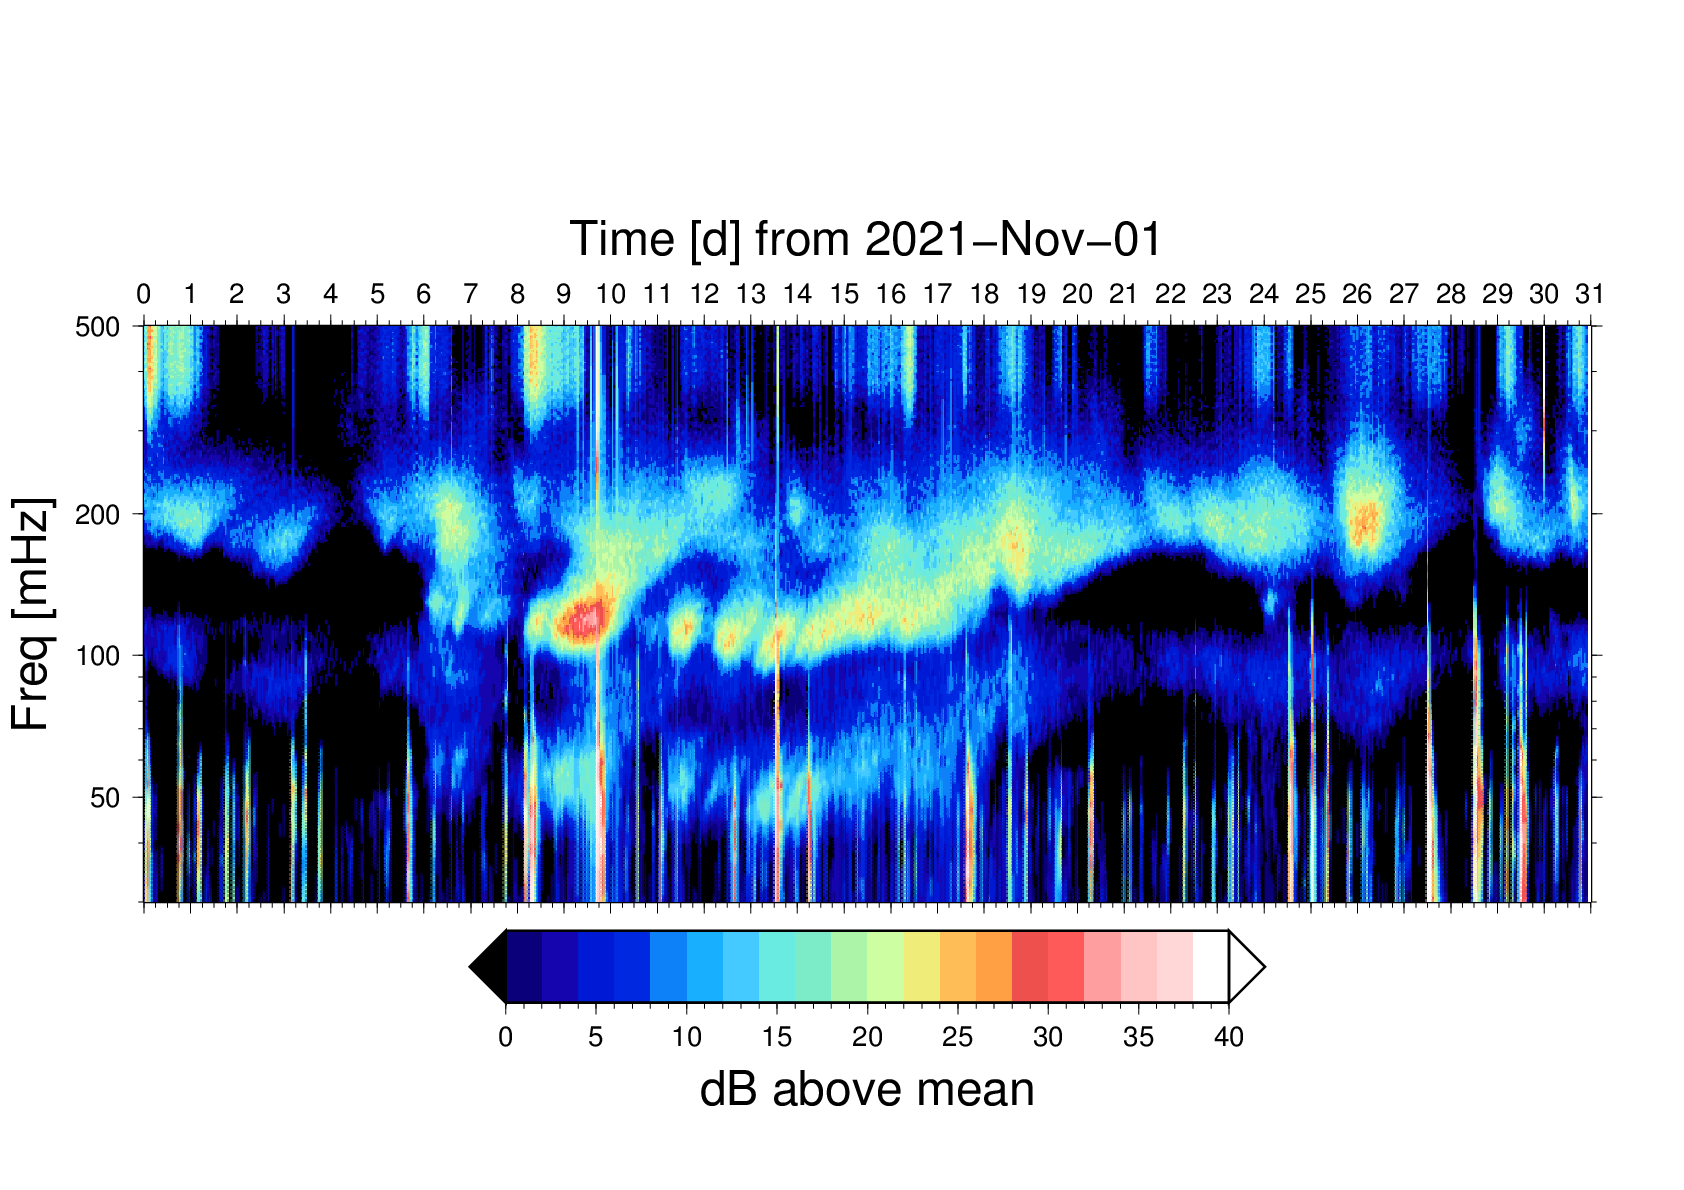
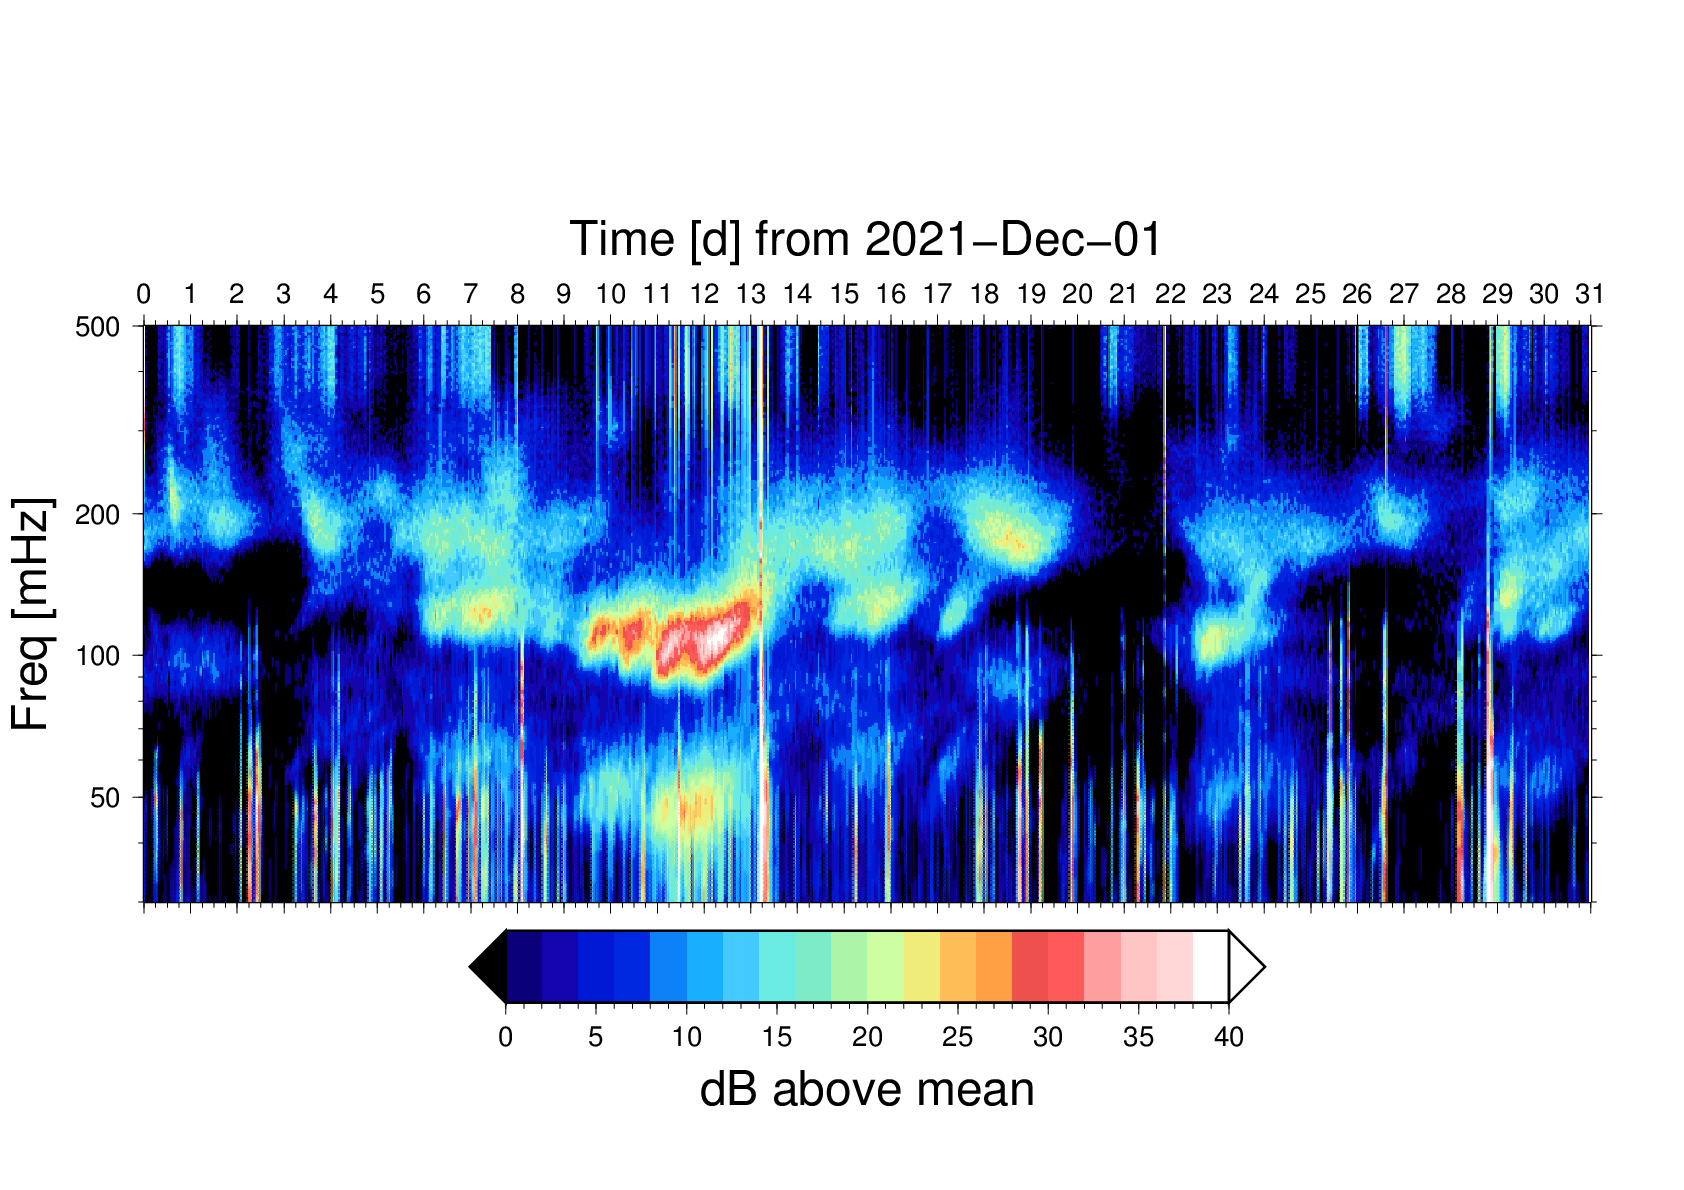
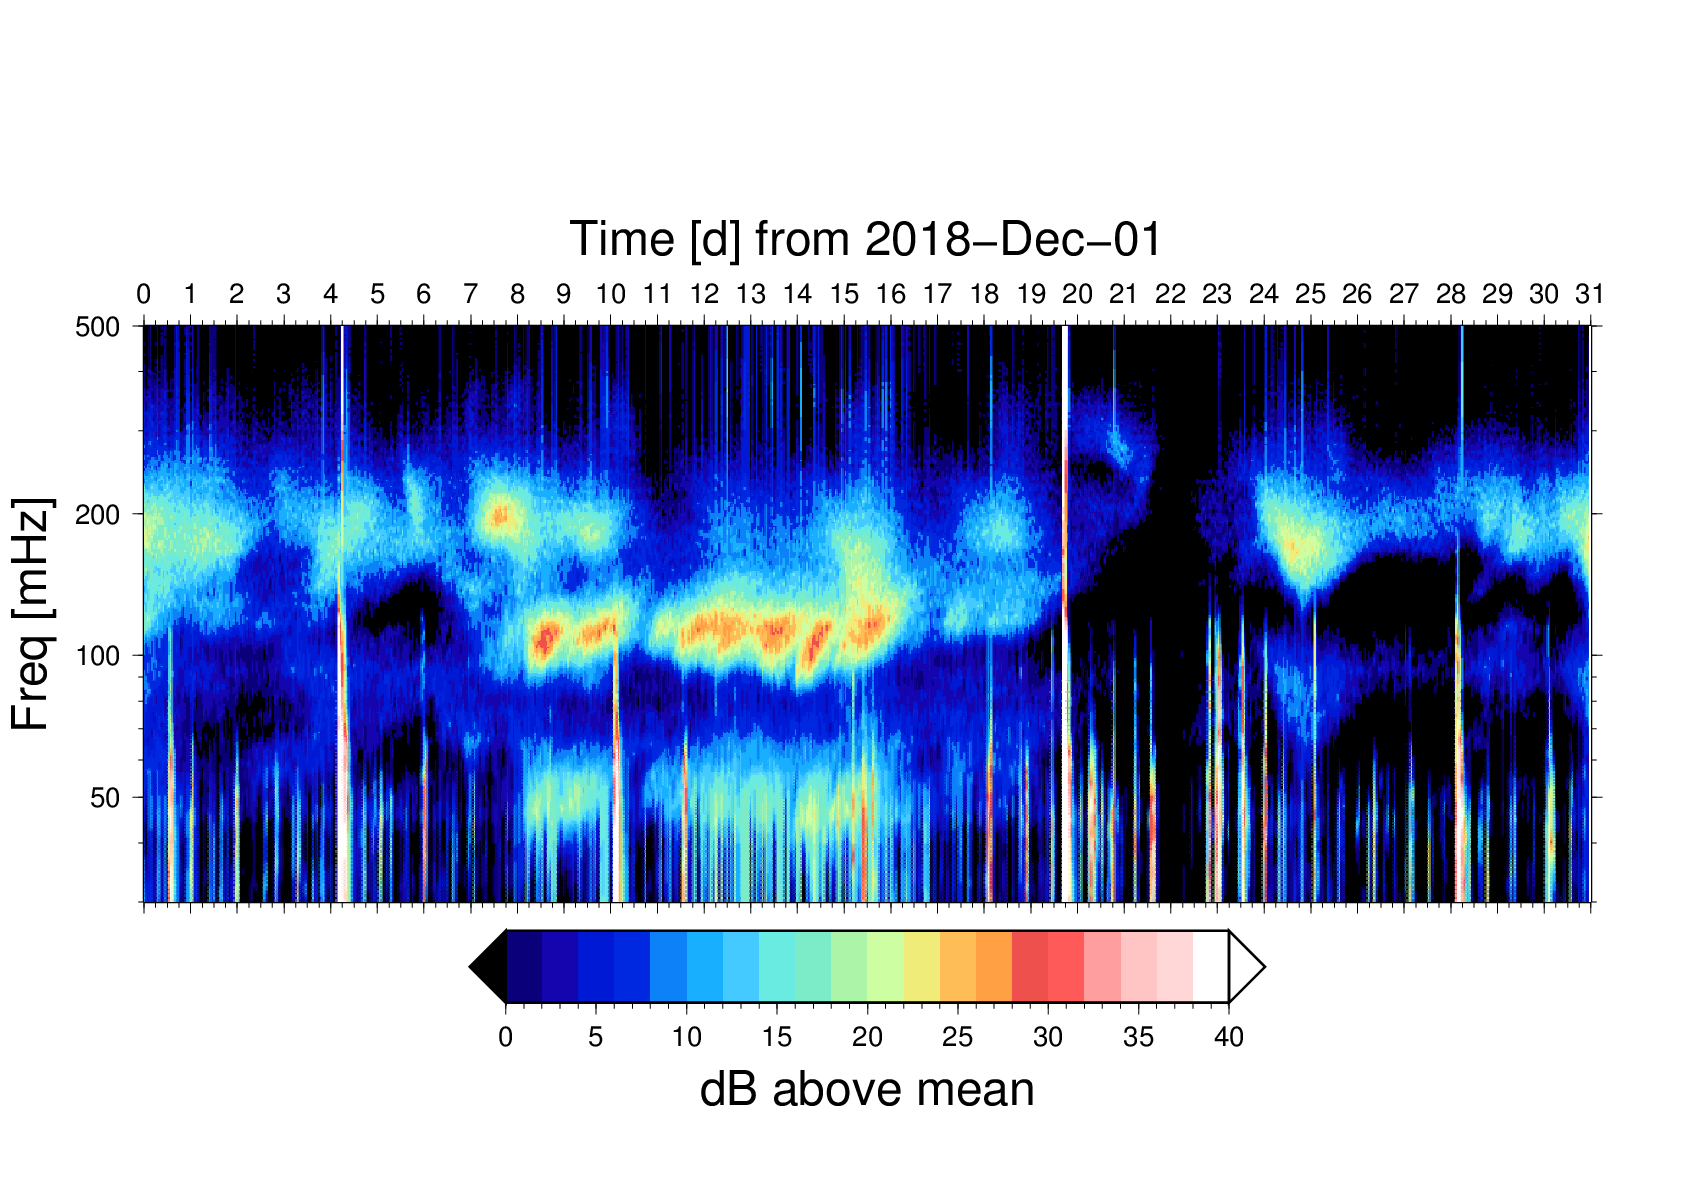
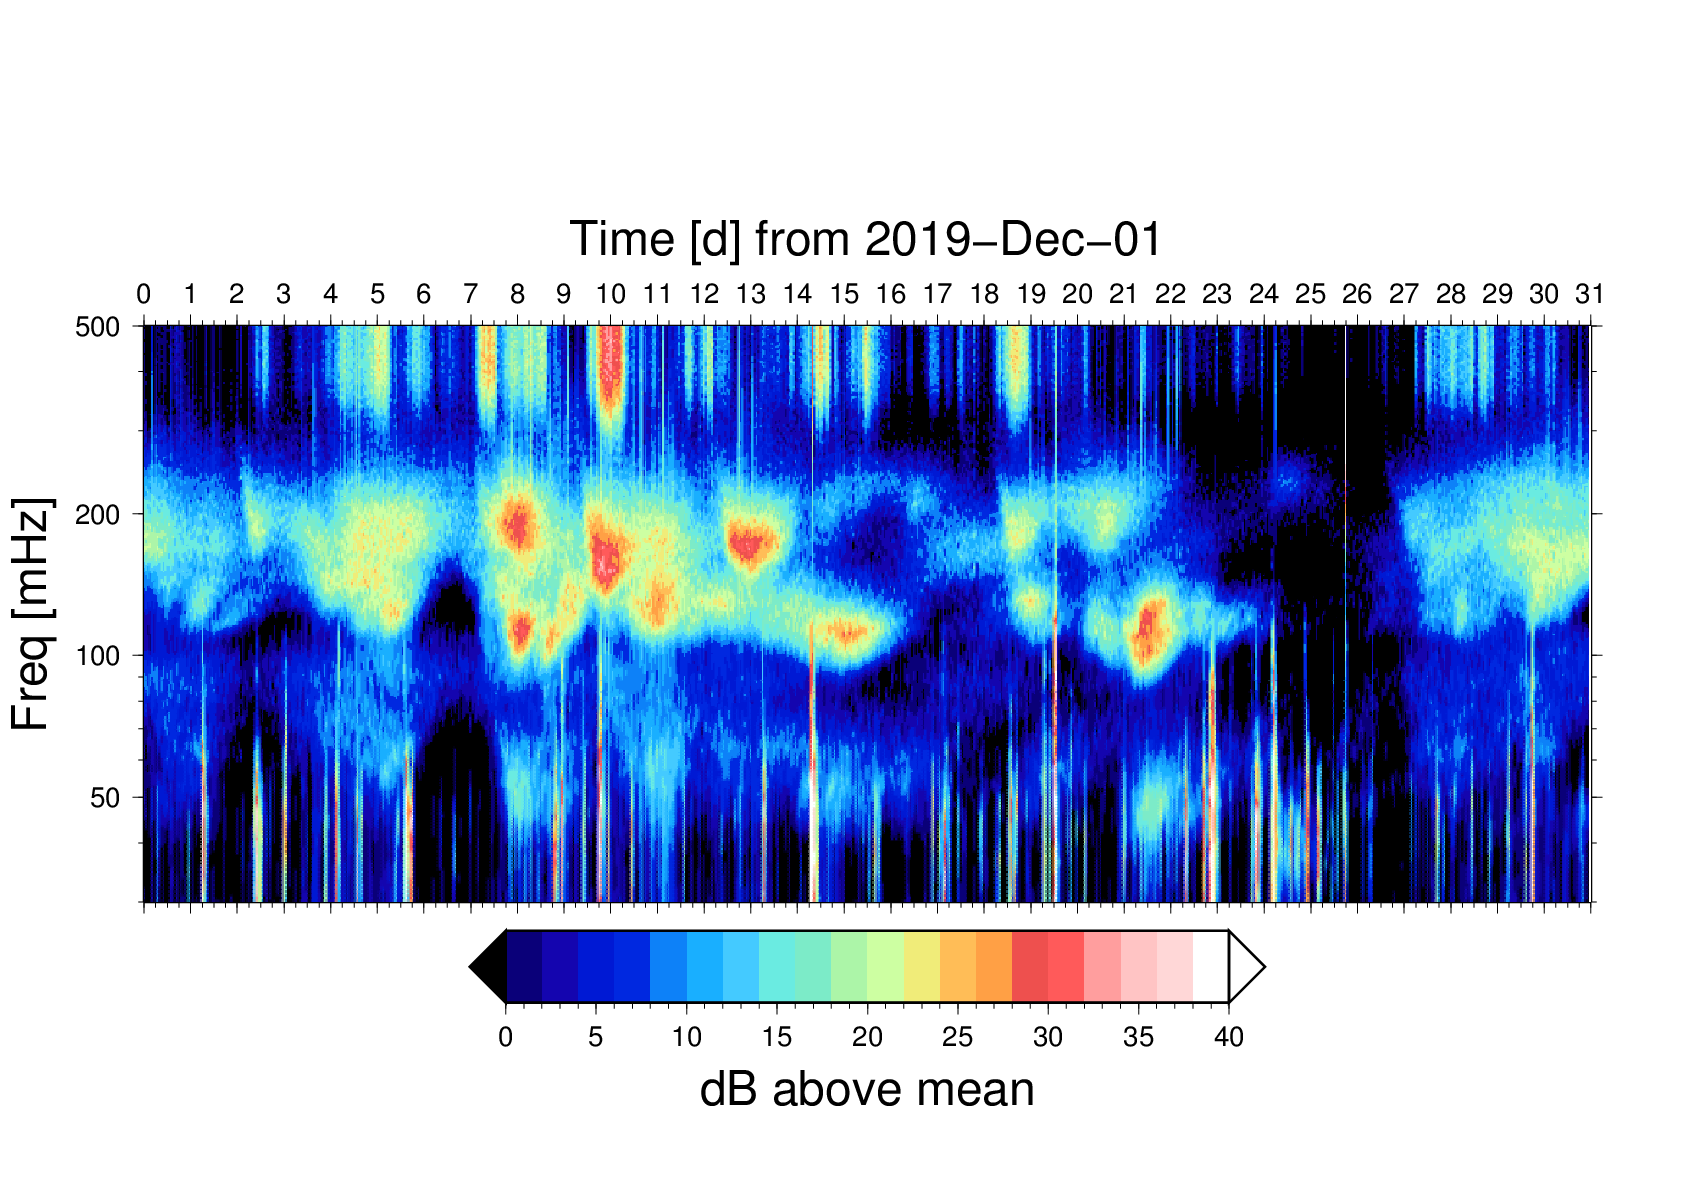
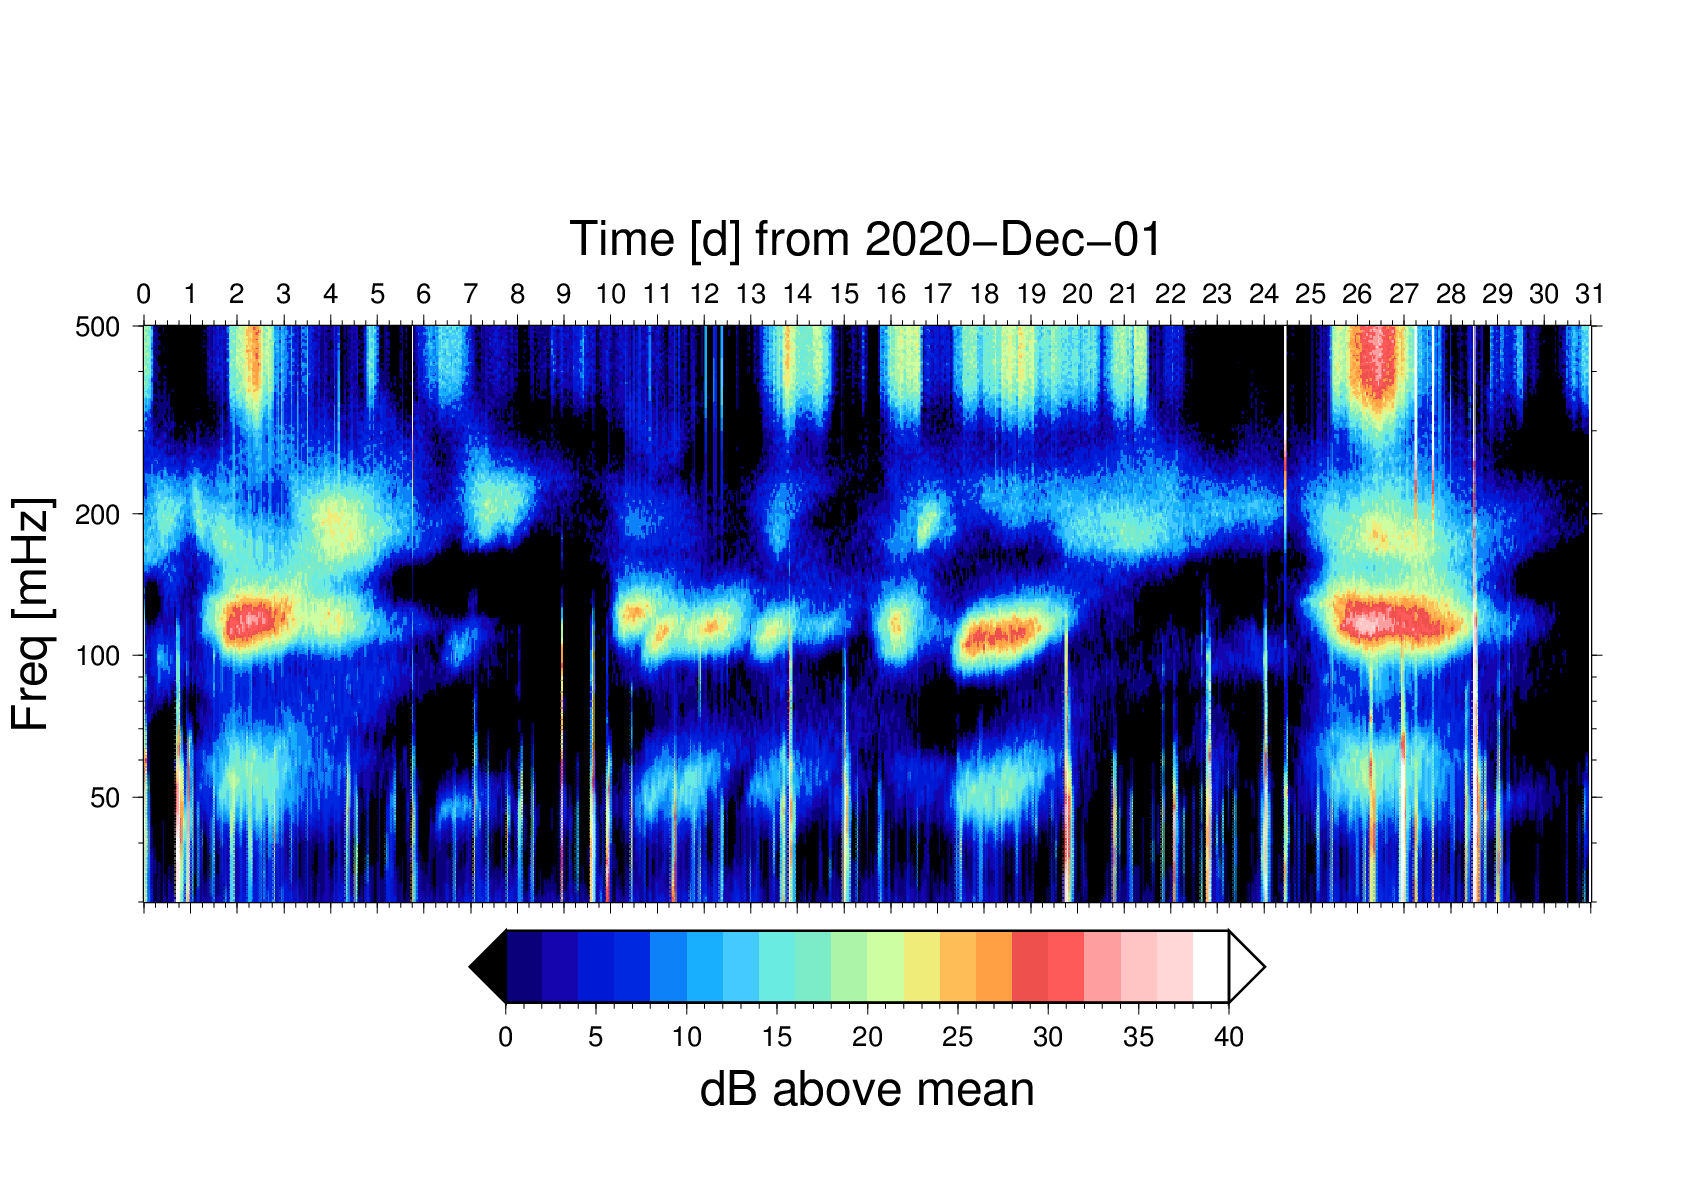
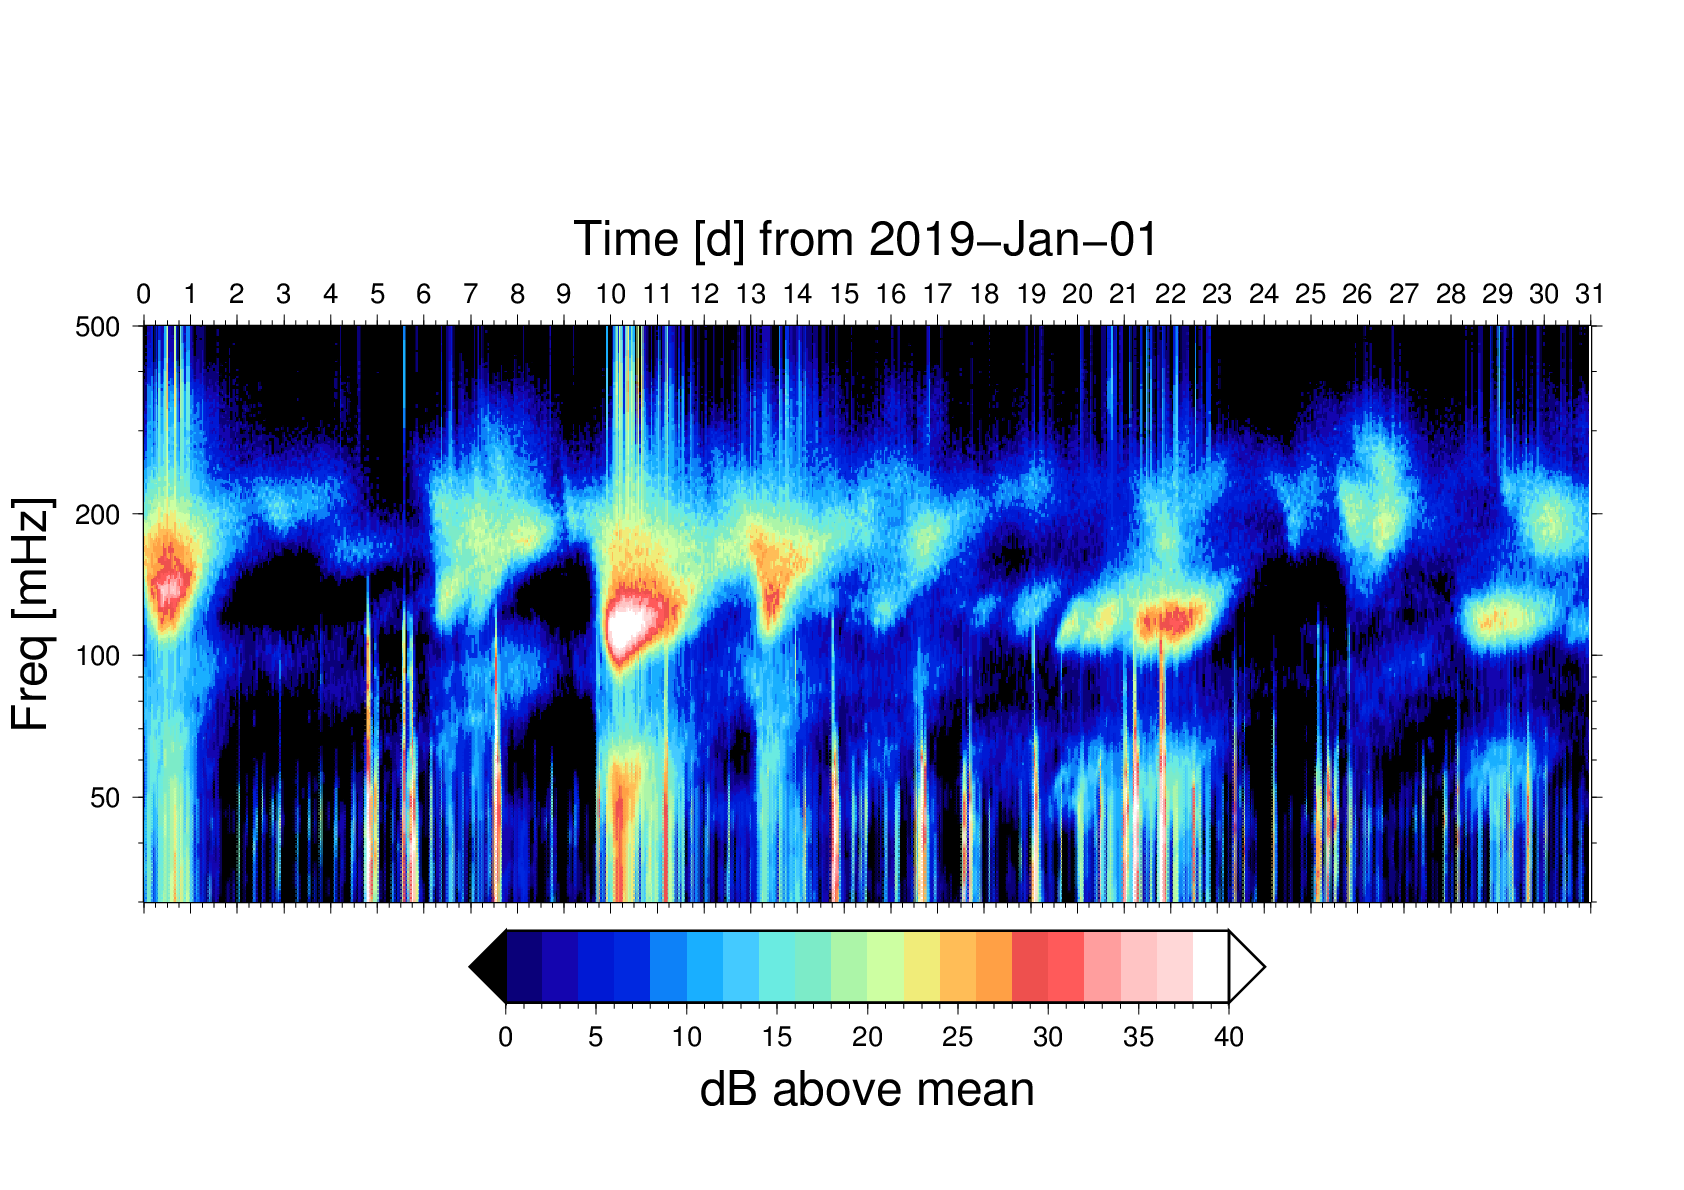
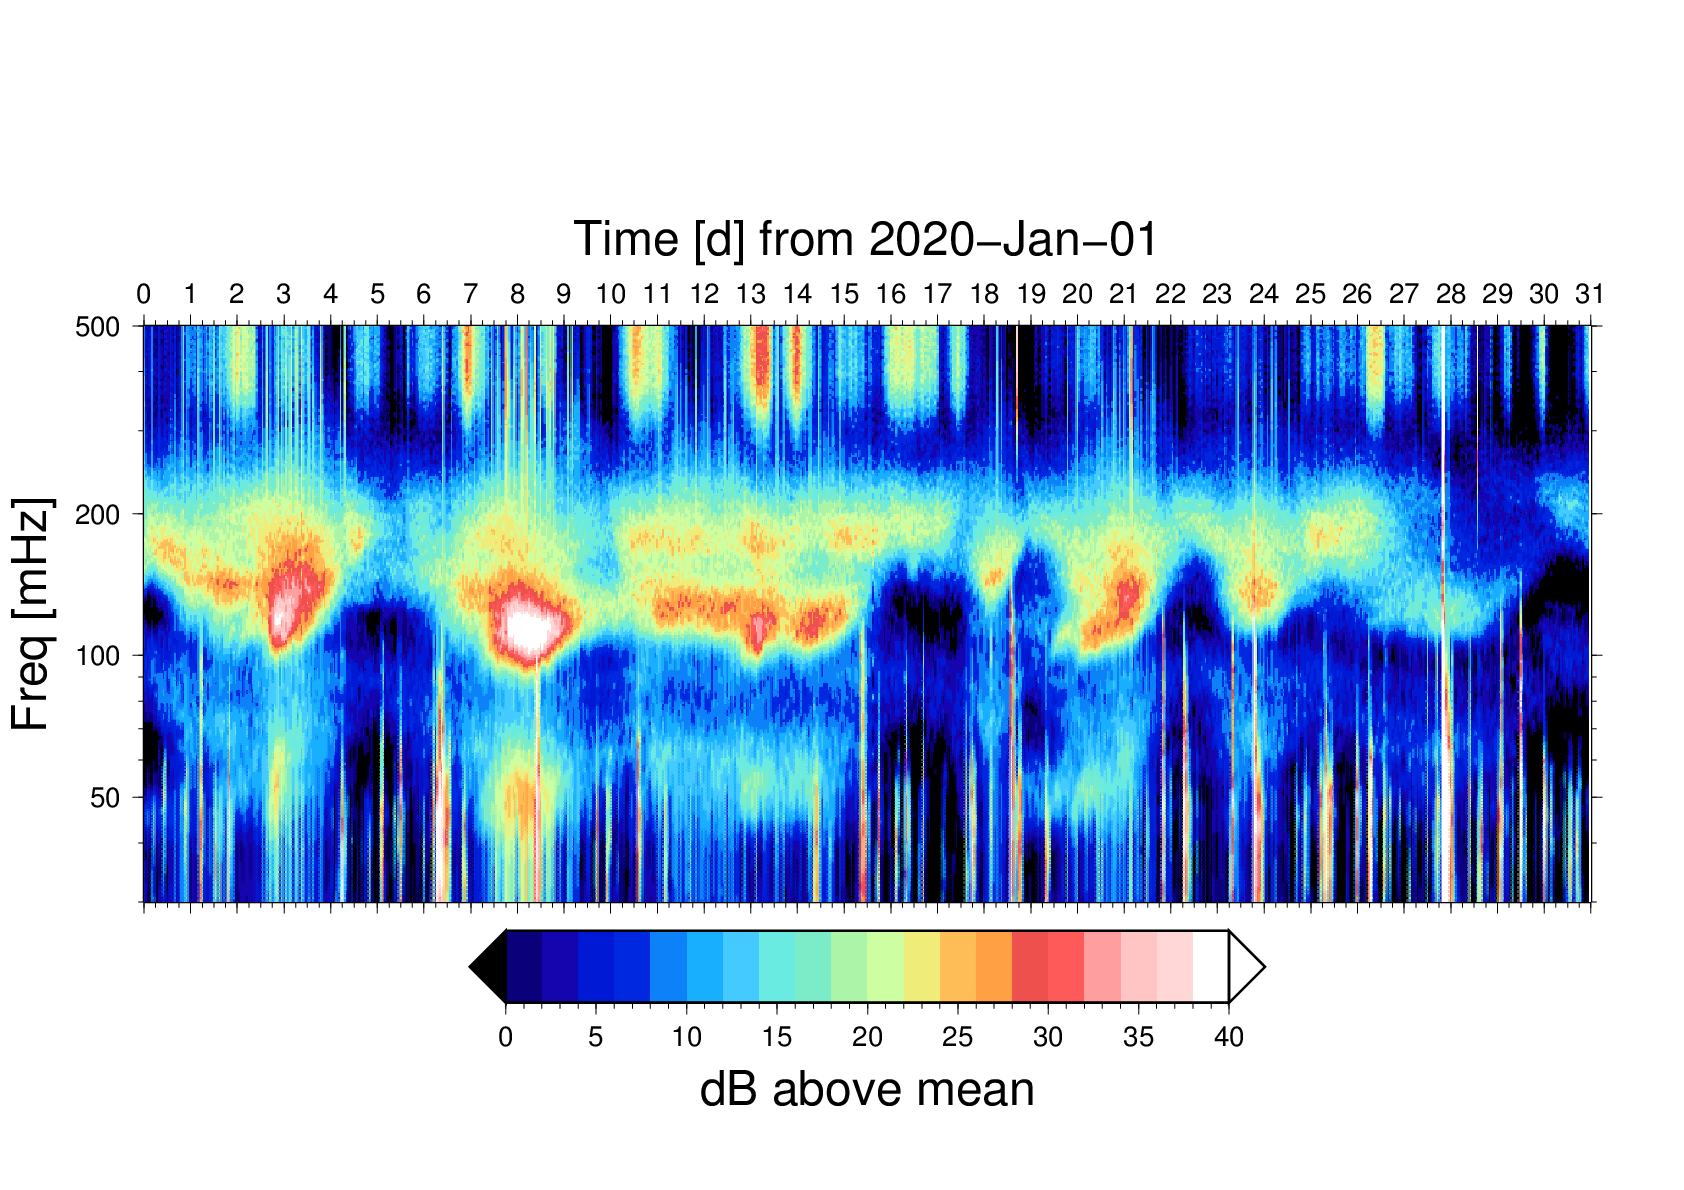
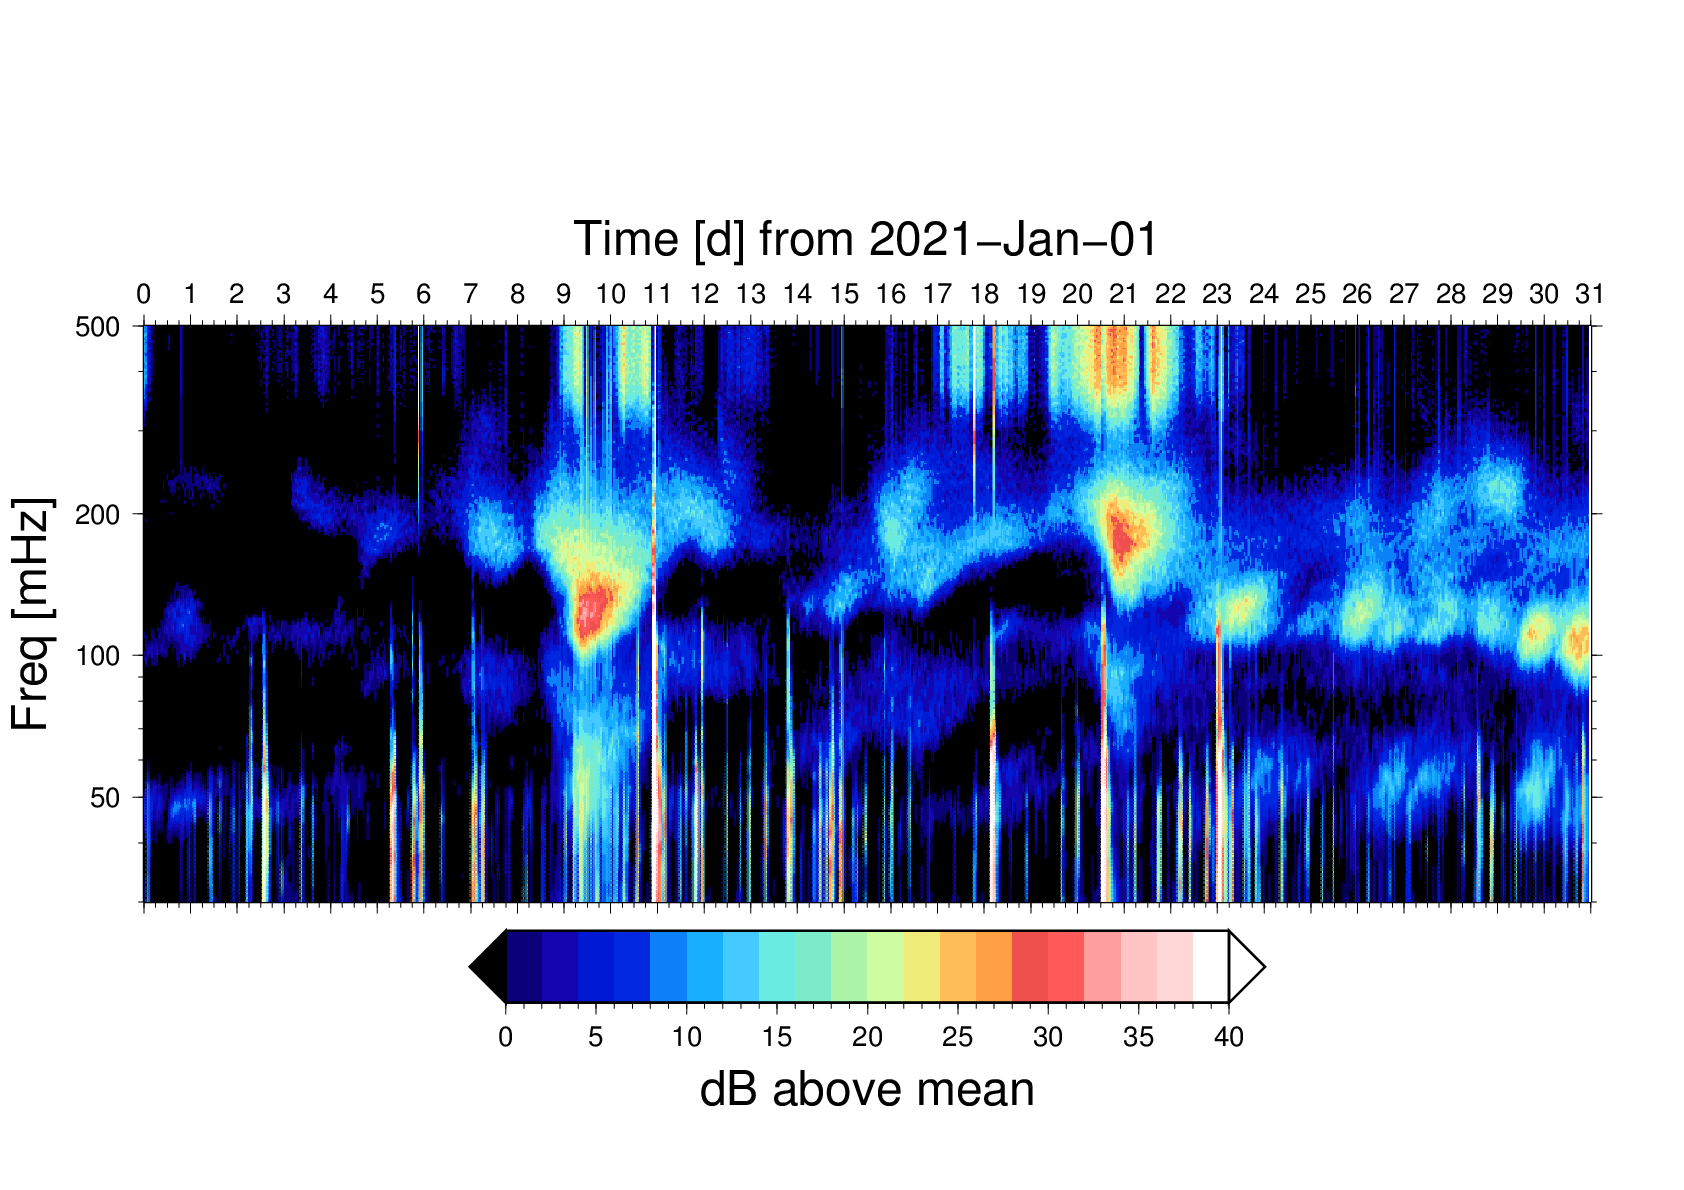
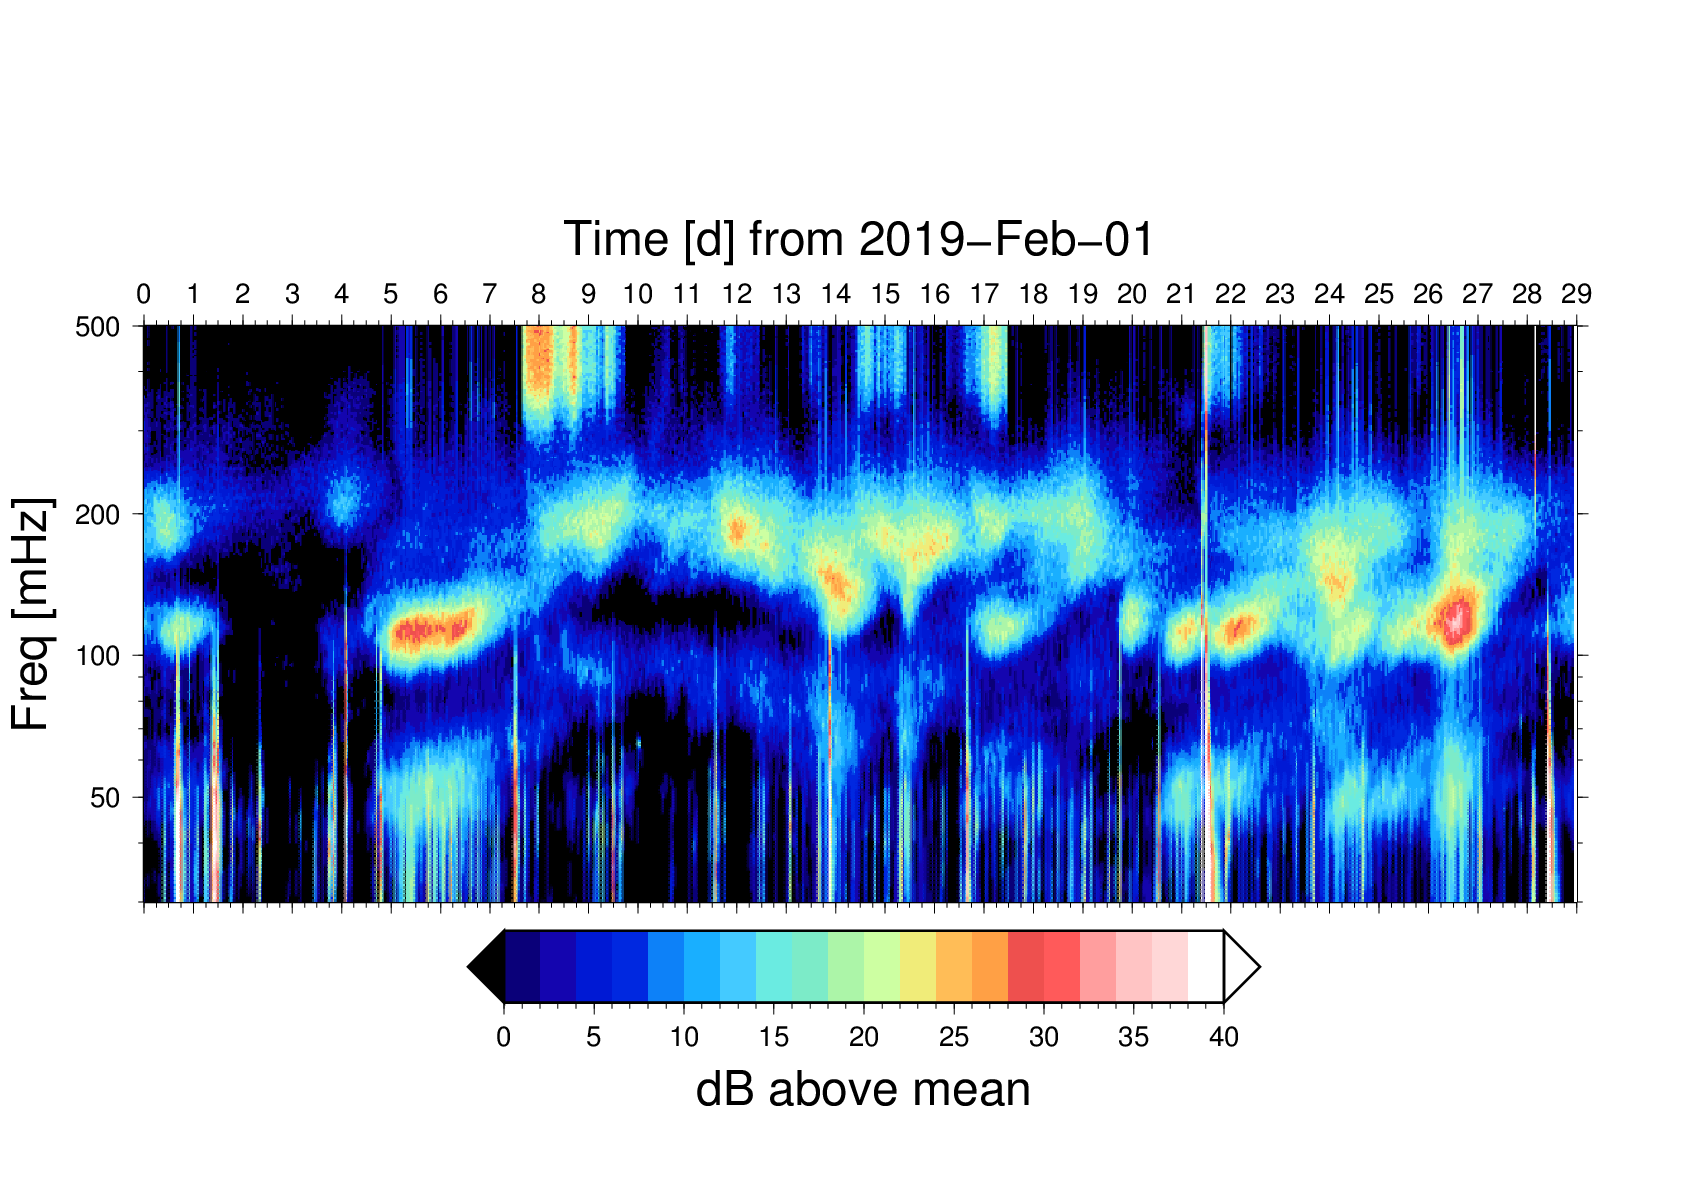
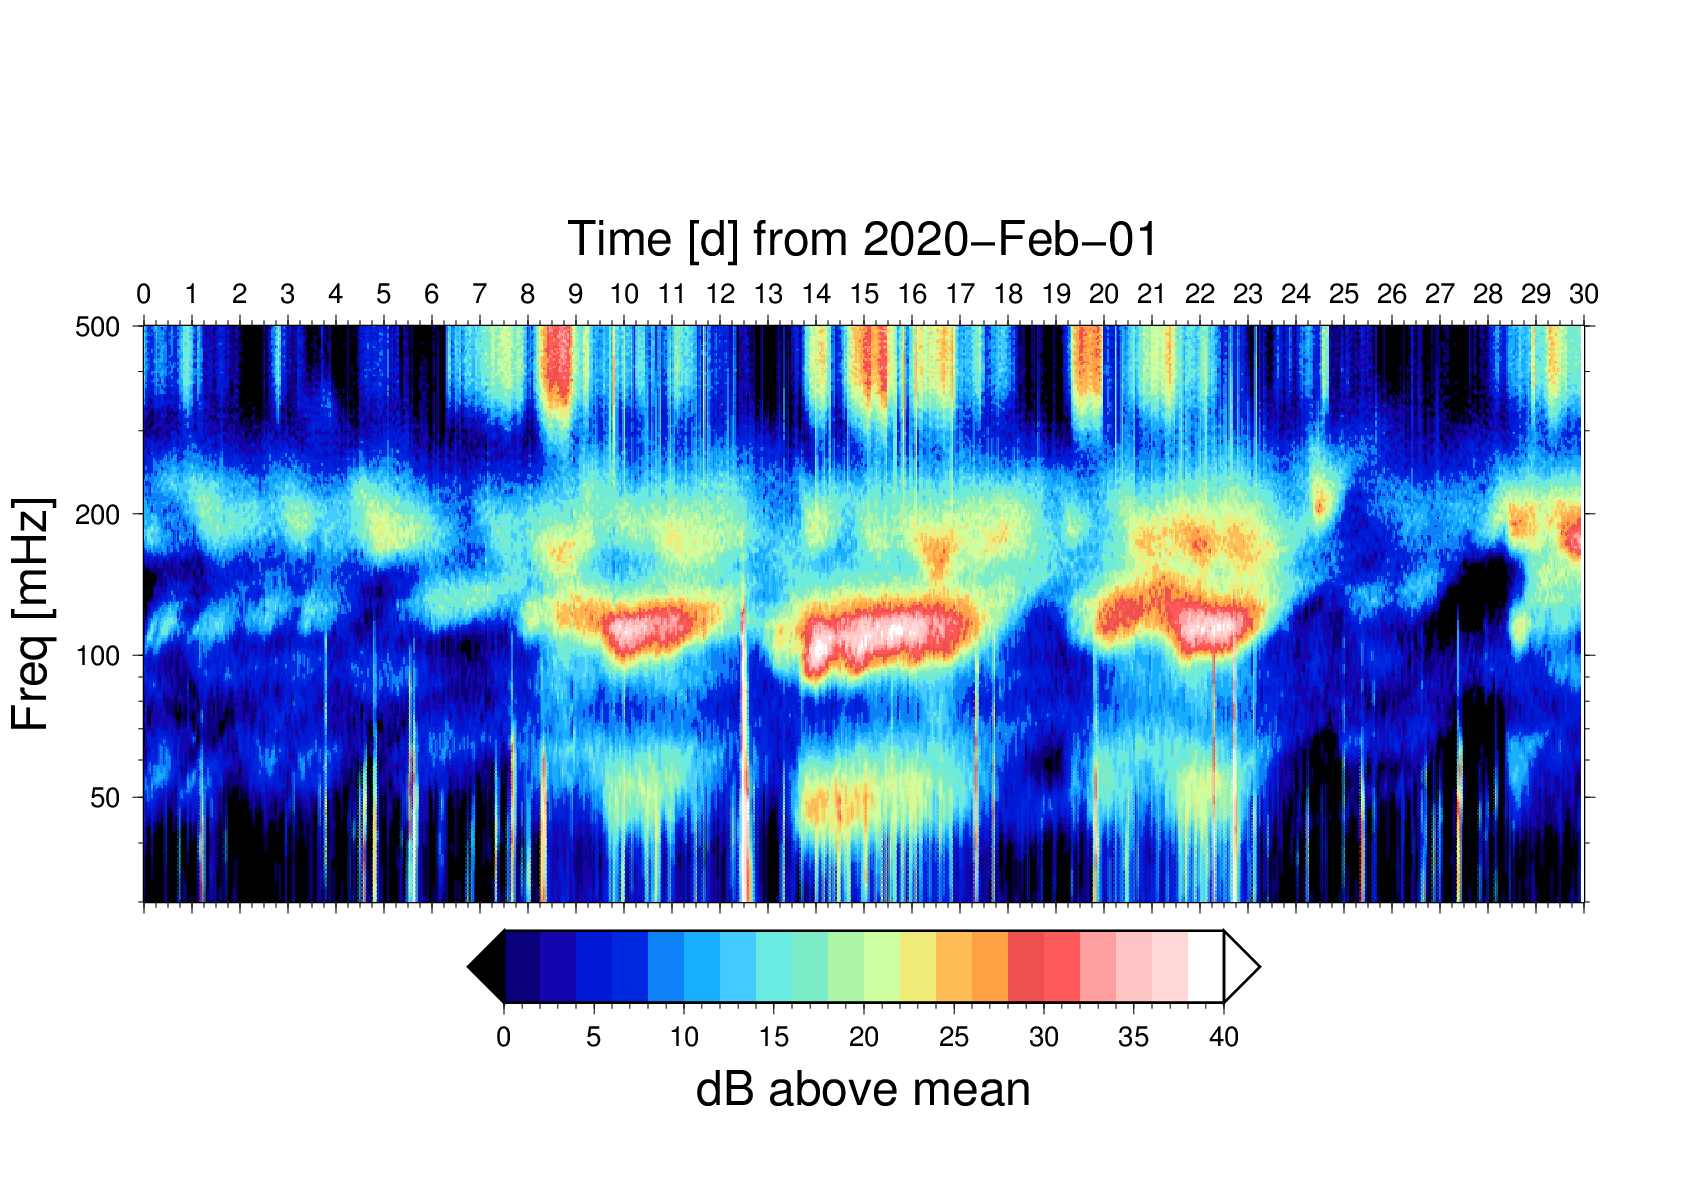
Spectrograms
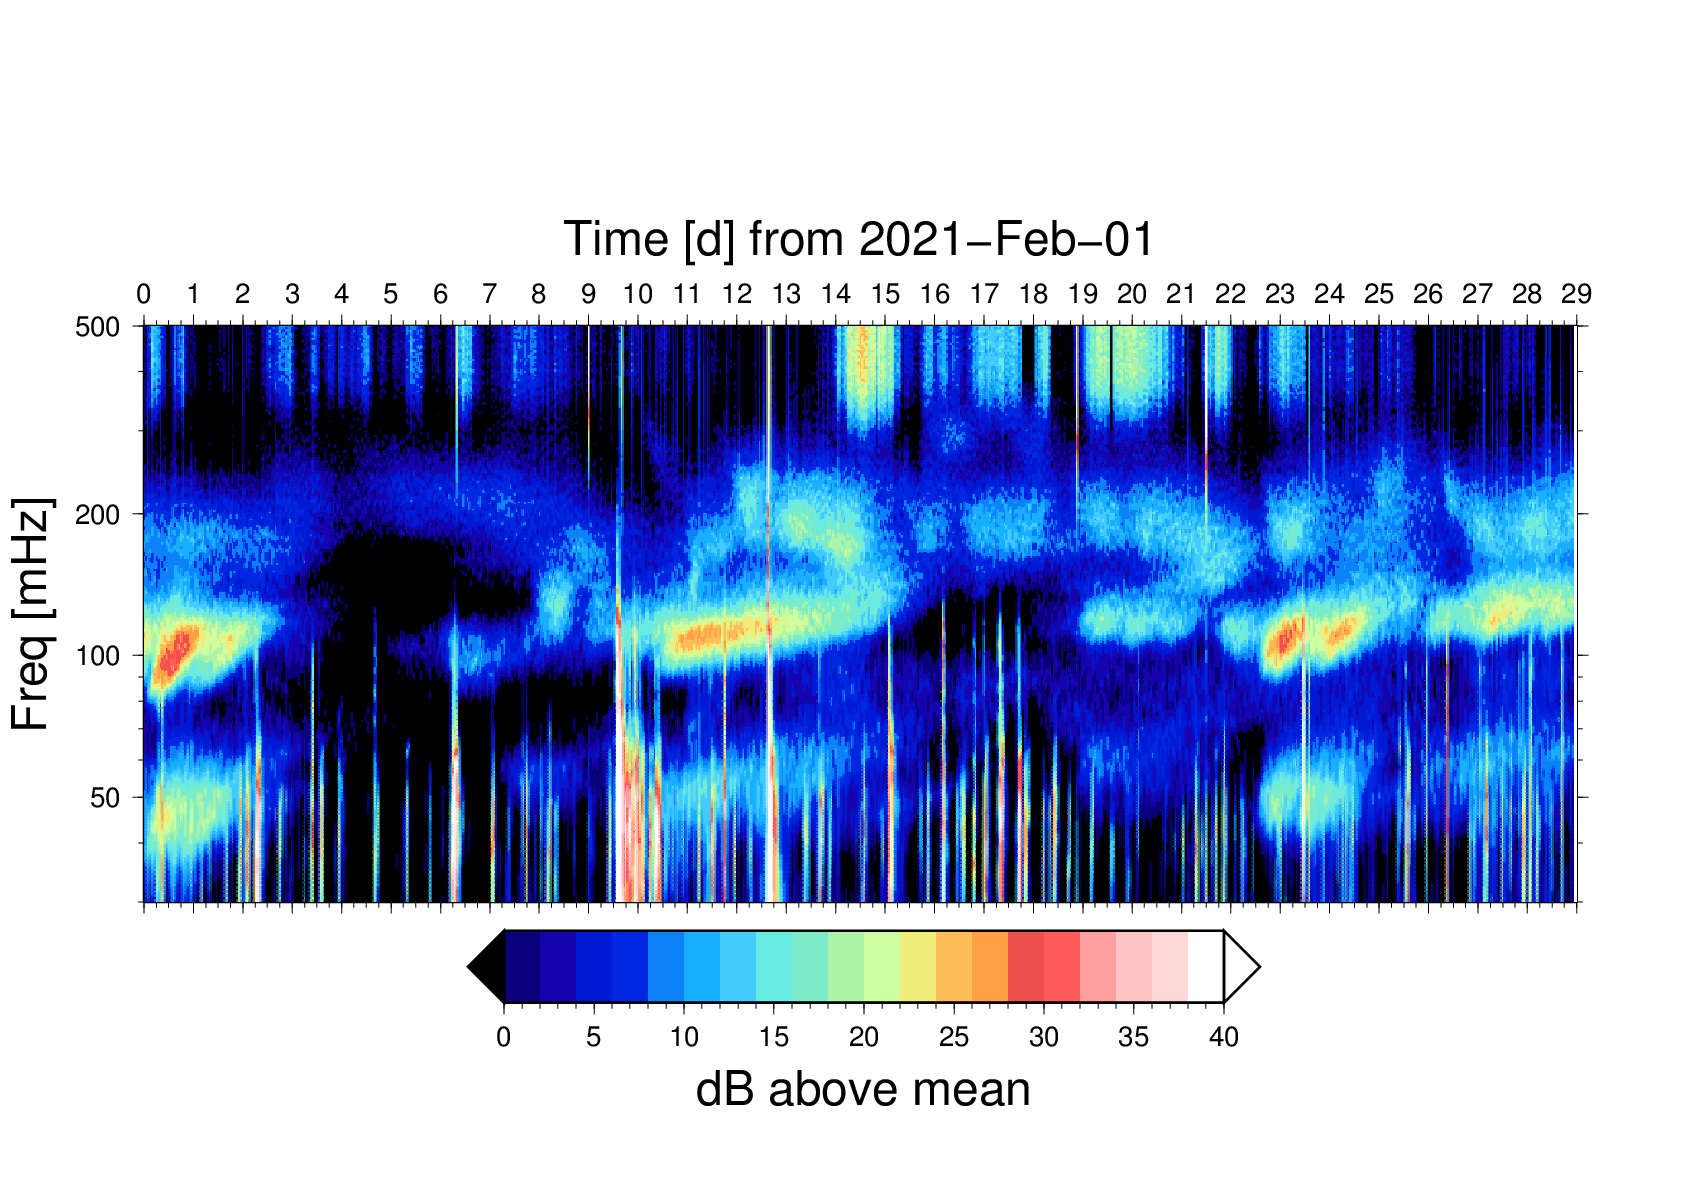
for 2018 through 2020
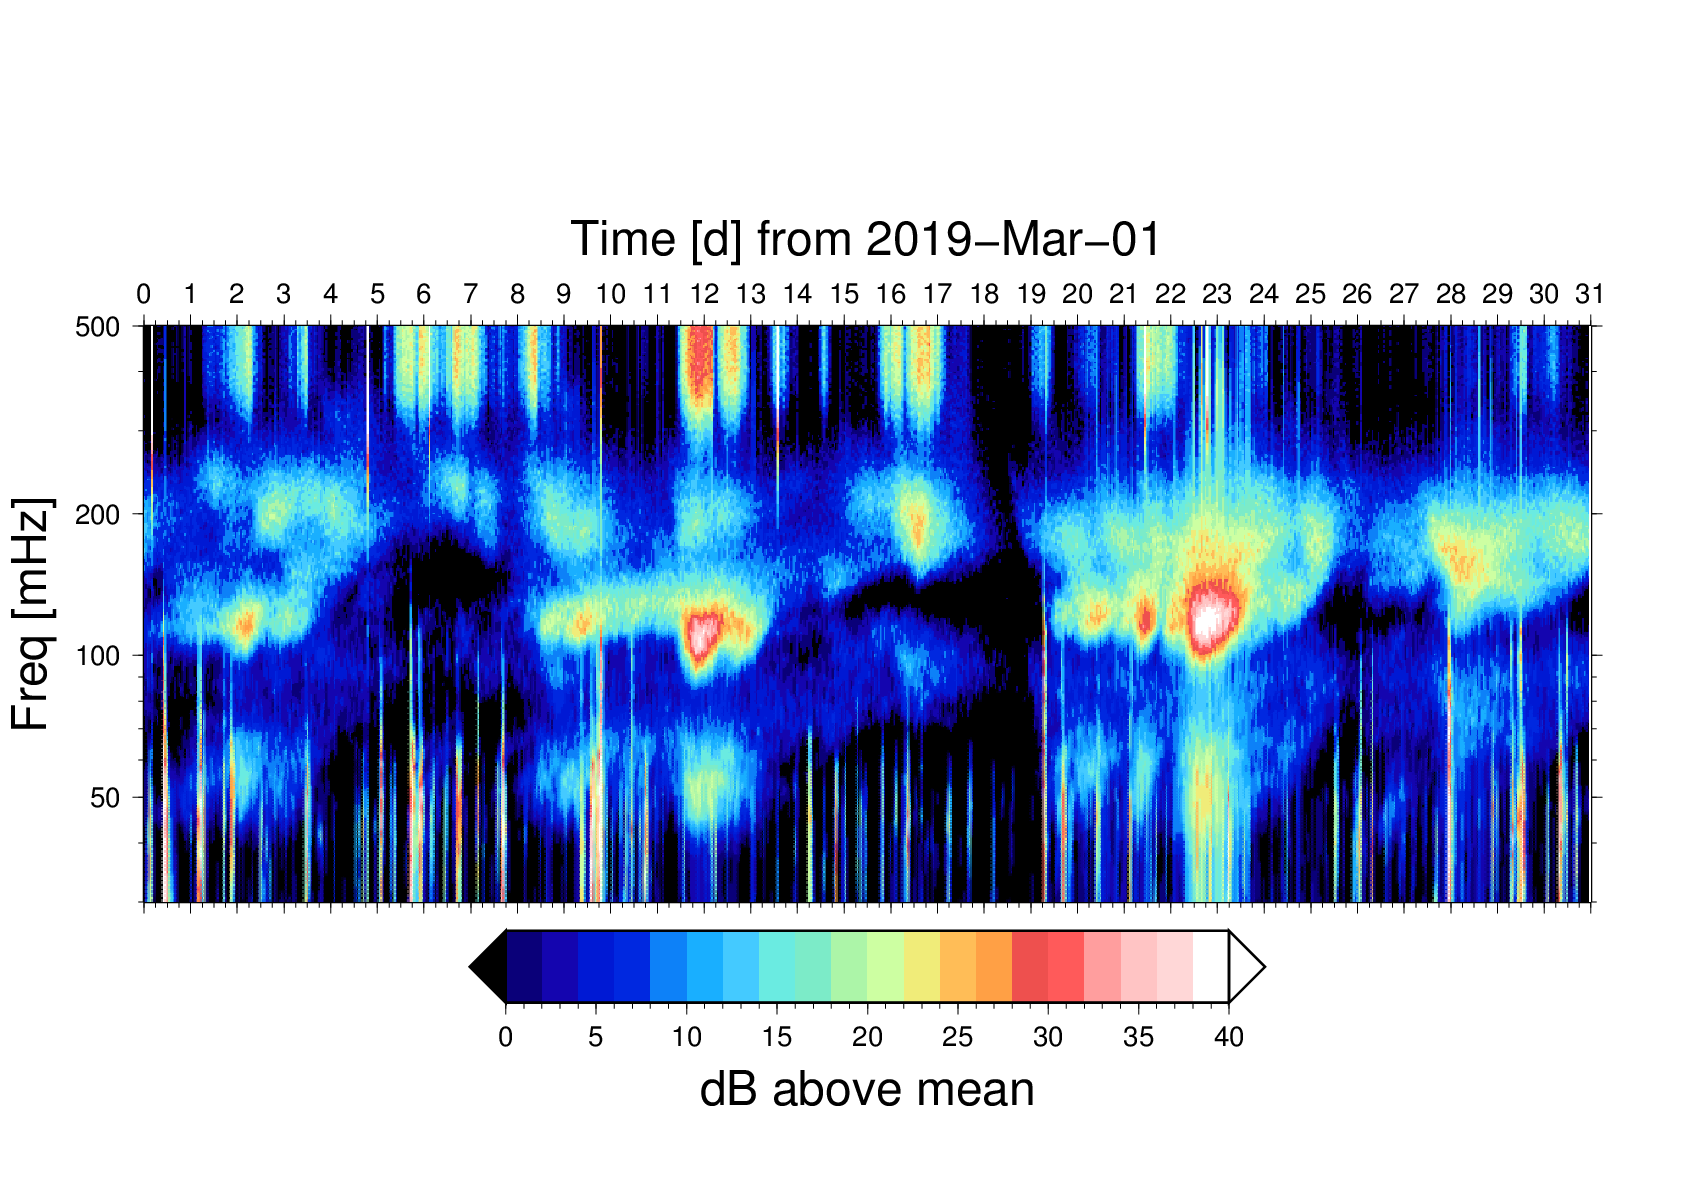
Spectrograms for 2016 through 2018
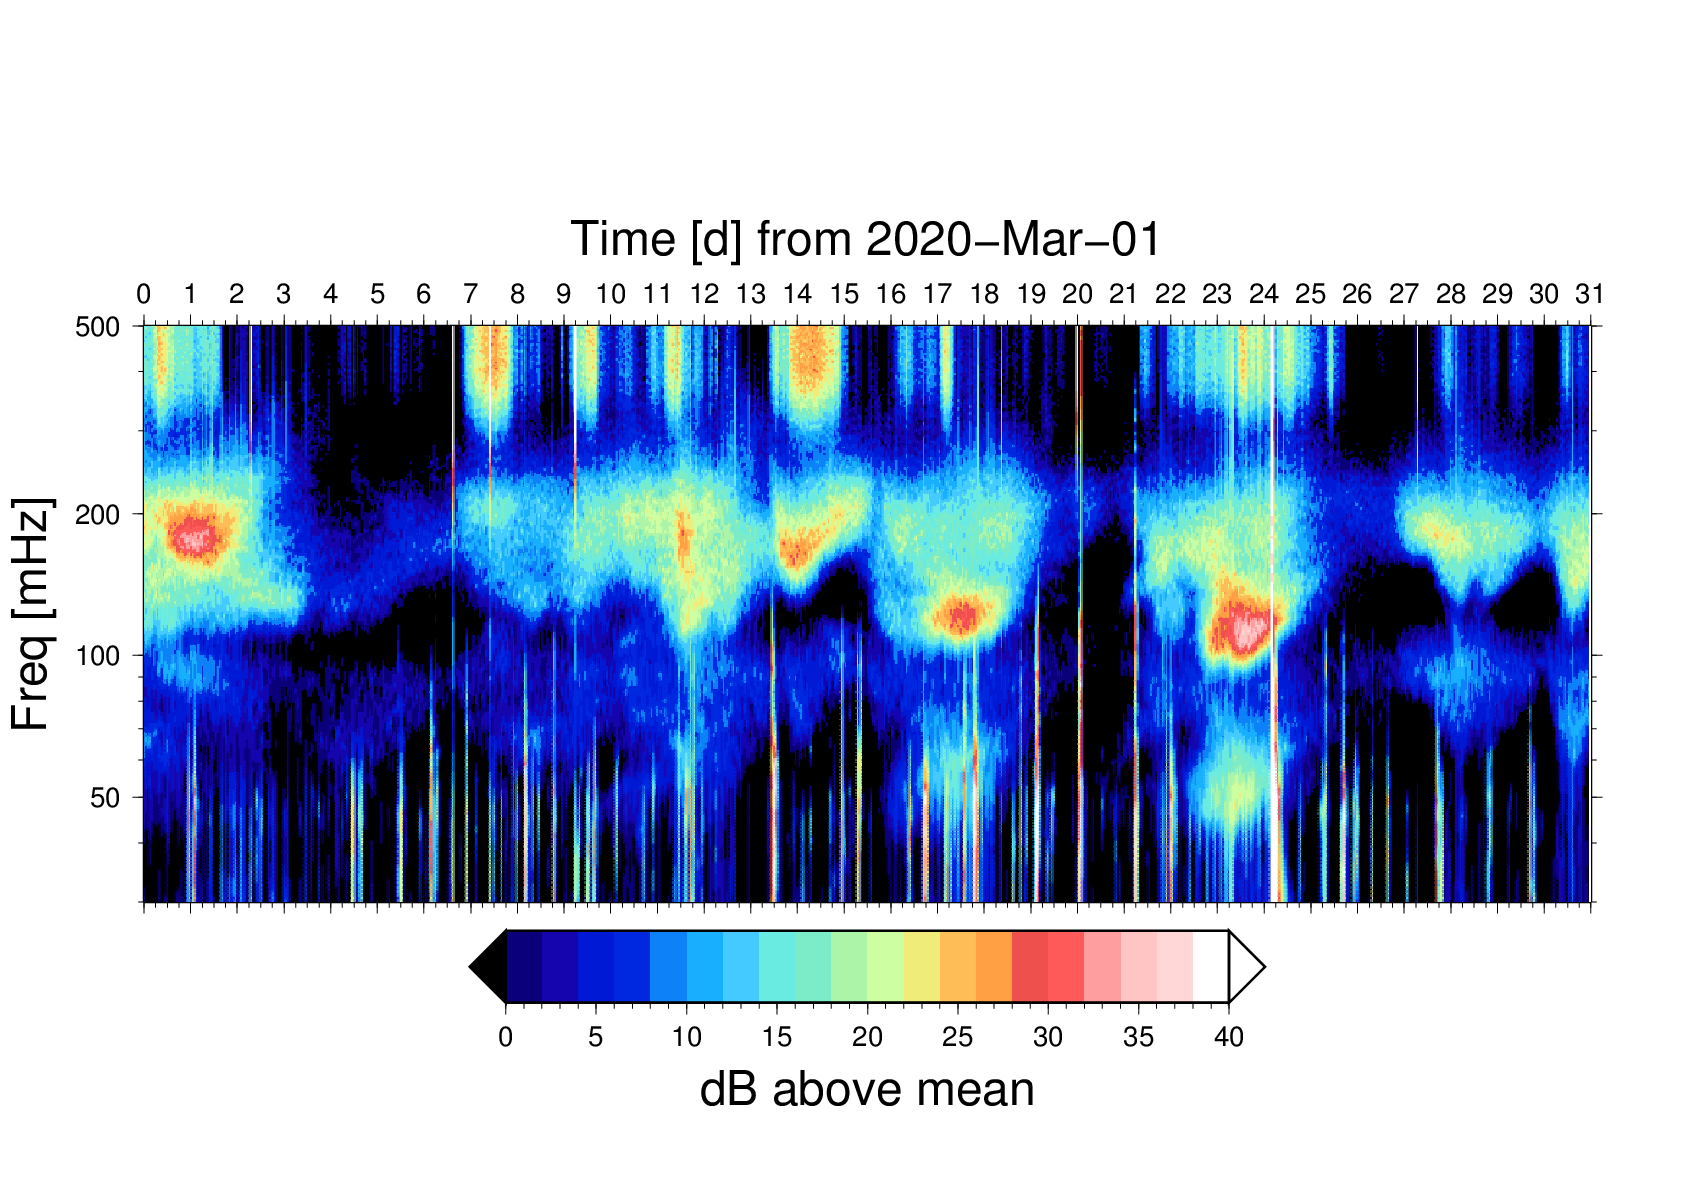
Spectrograms for 2014 through 2016
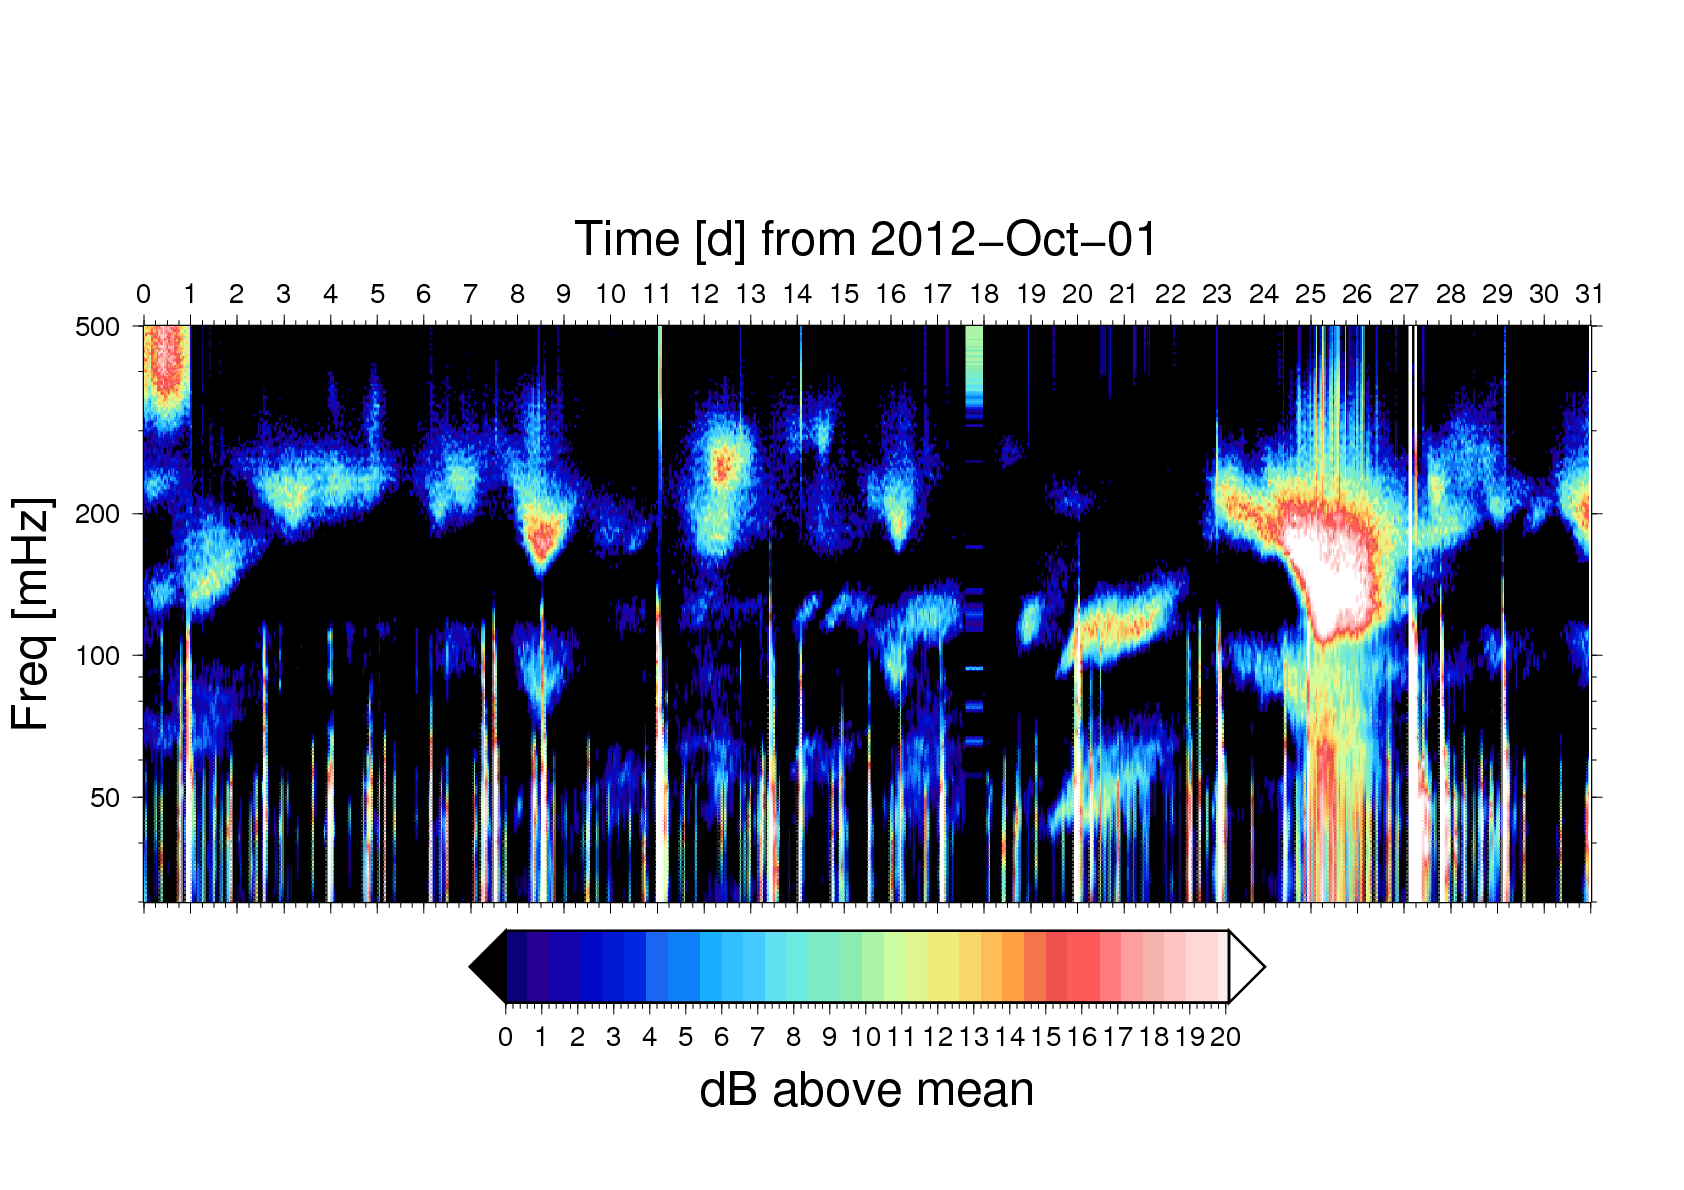
Spectrograms
for 2012 through 2013
Spectrograms for July 2009 through Dec 2011
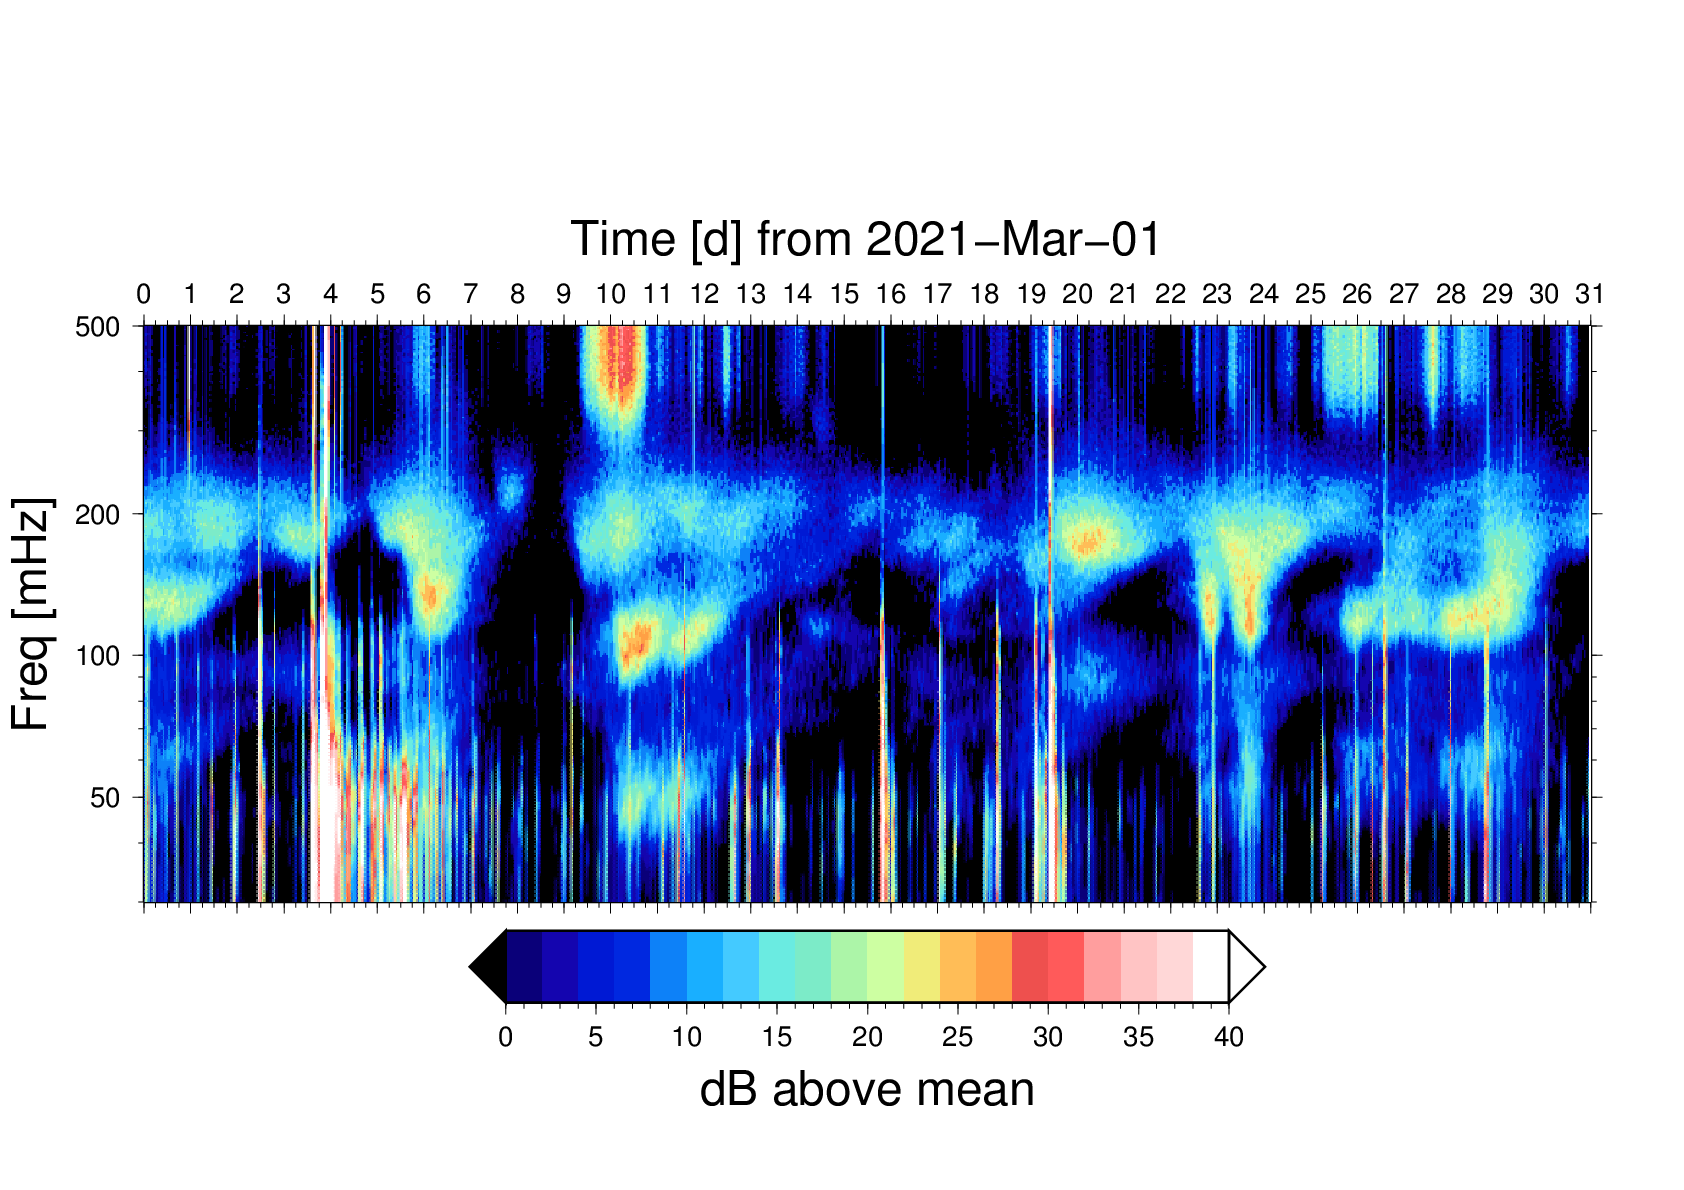
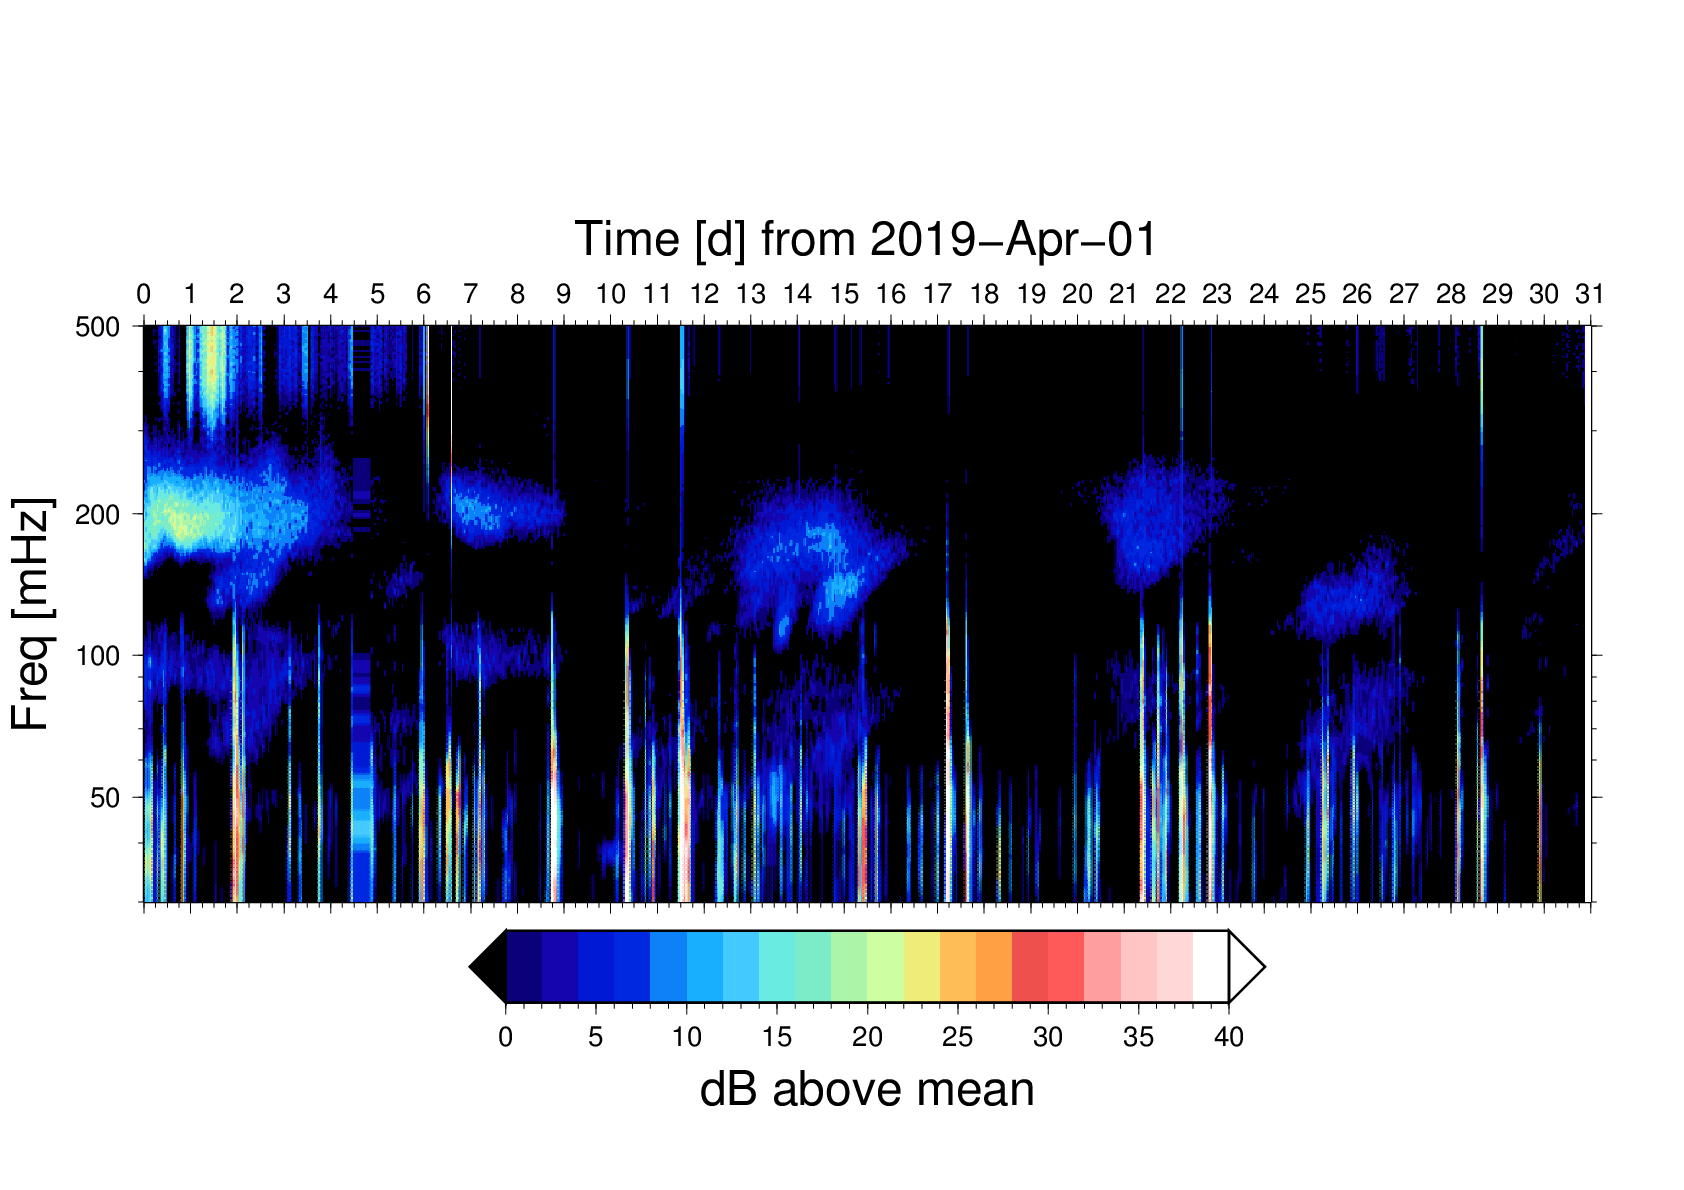
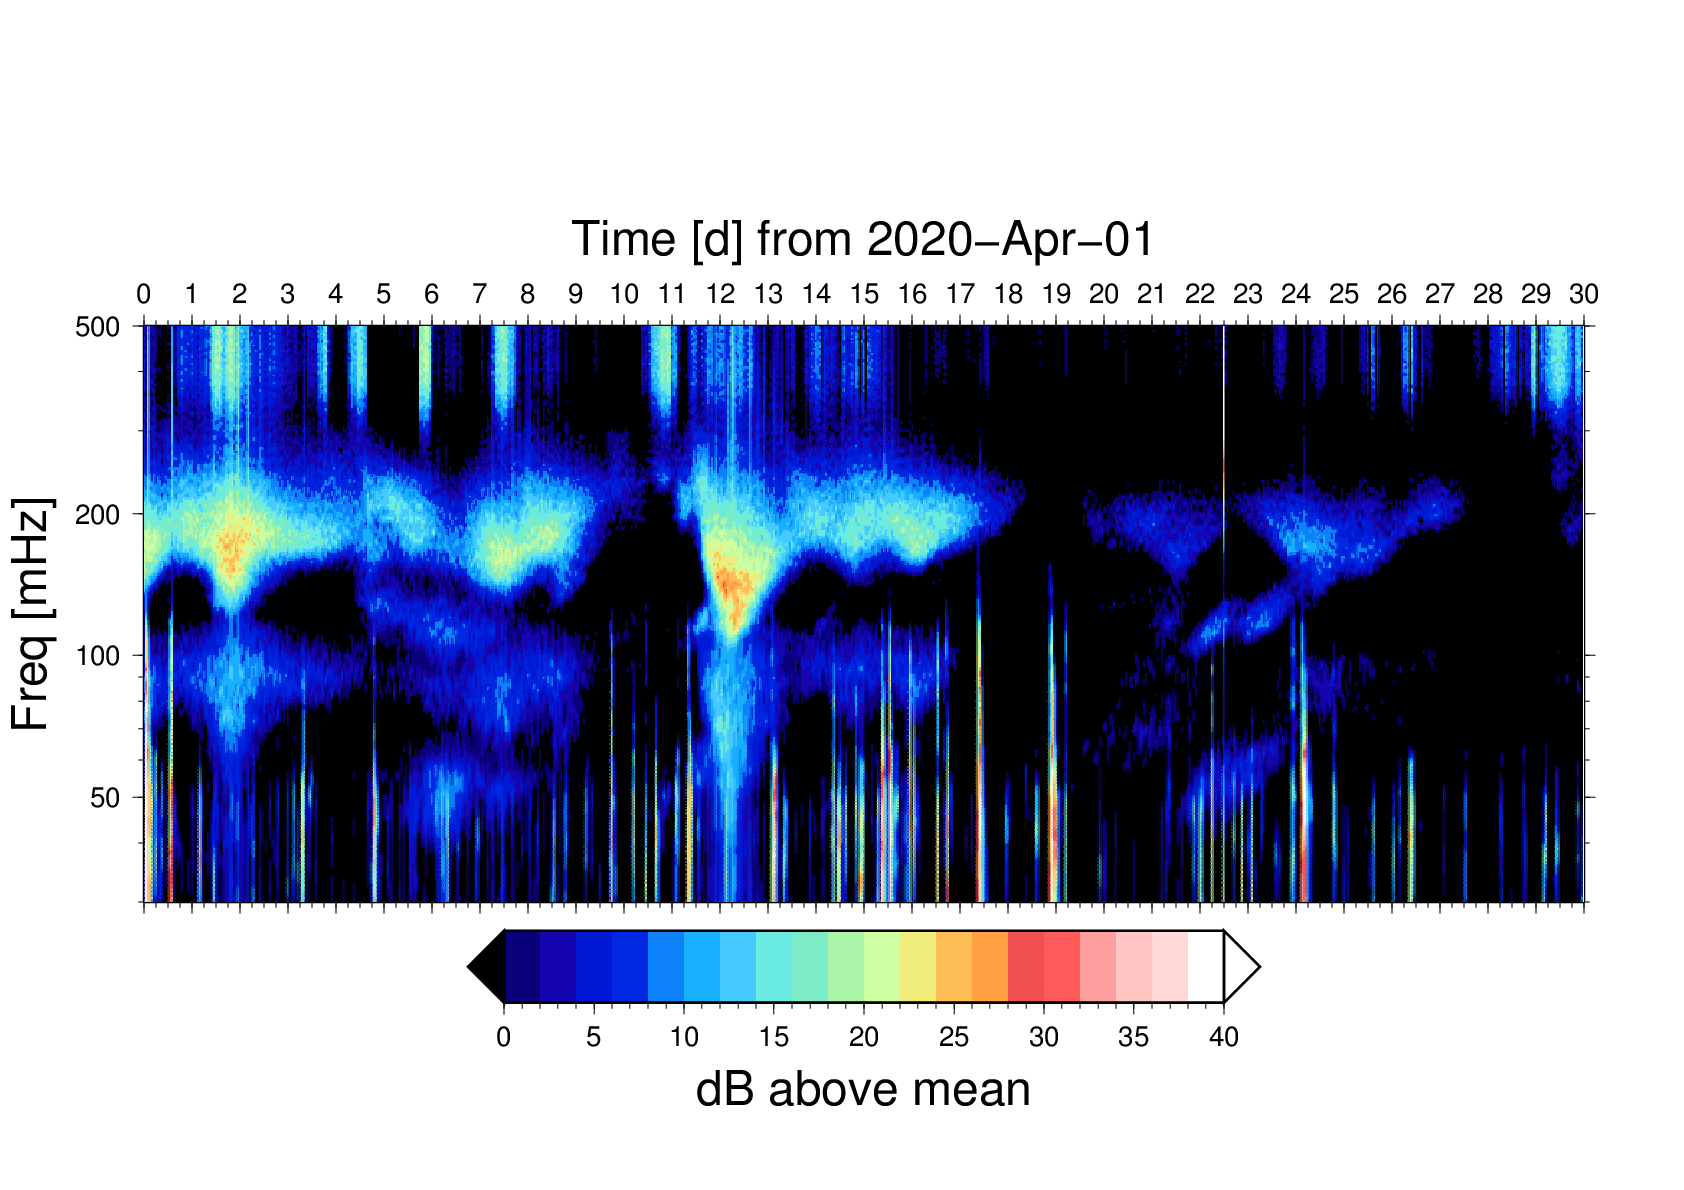
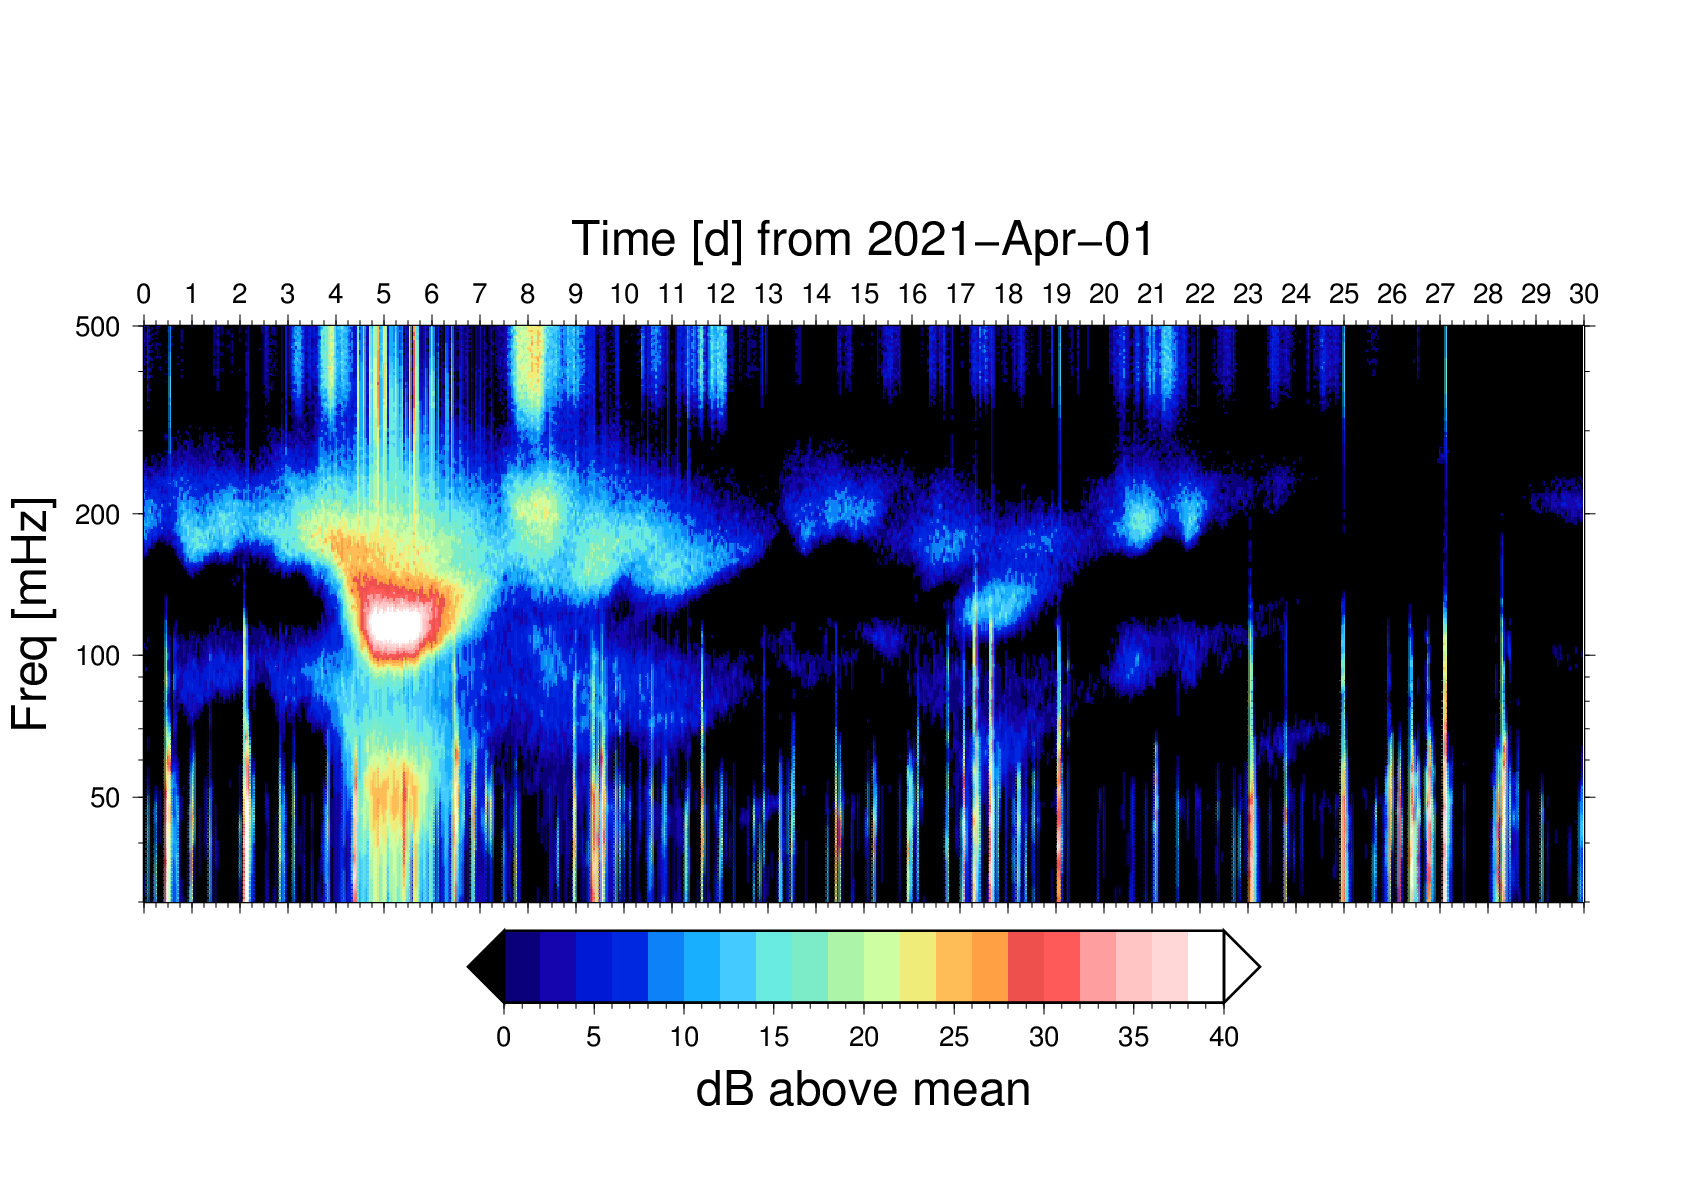
| A power spectrum
is estimated for every hour from 1-second sampled
superconducting gravity data. But first, a mean spectral
background has been estimated from a succession of five days
(can be/shall be improved), and the power of a particular
time slice is divided by this average power. The resulting
"power above mean" in dB units is indicated by colours. The measure of the mean here is the harmonic mean (RMS of decibel units), which emphasizes the lower values. The many singular vertical stripes are caused by earthquakes. The longer-duration blobs and blotches are caused by oceanic waves, often surprisingly far away (see the live gravity monitor, MEM power spectrum); note the skidding of peak power with respect to frequency. |