USGS most recent notification:
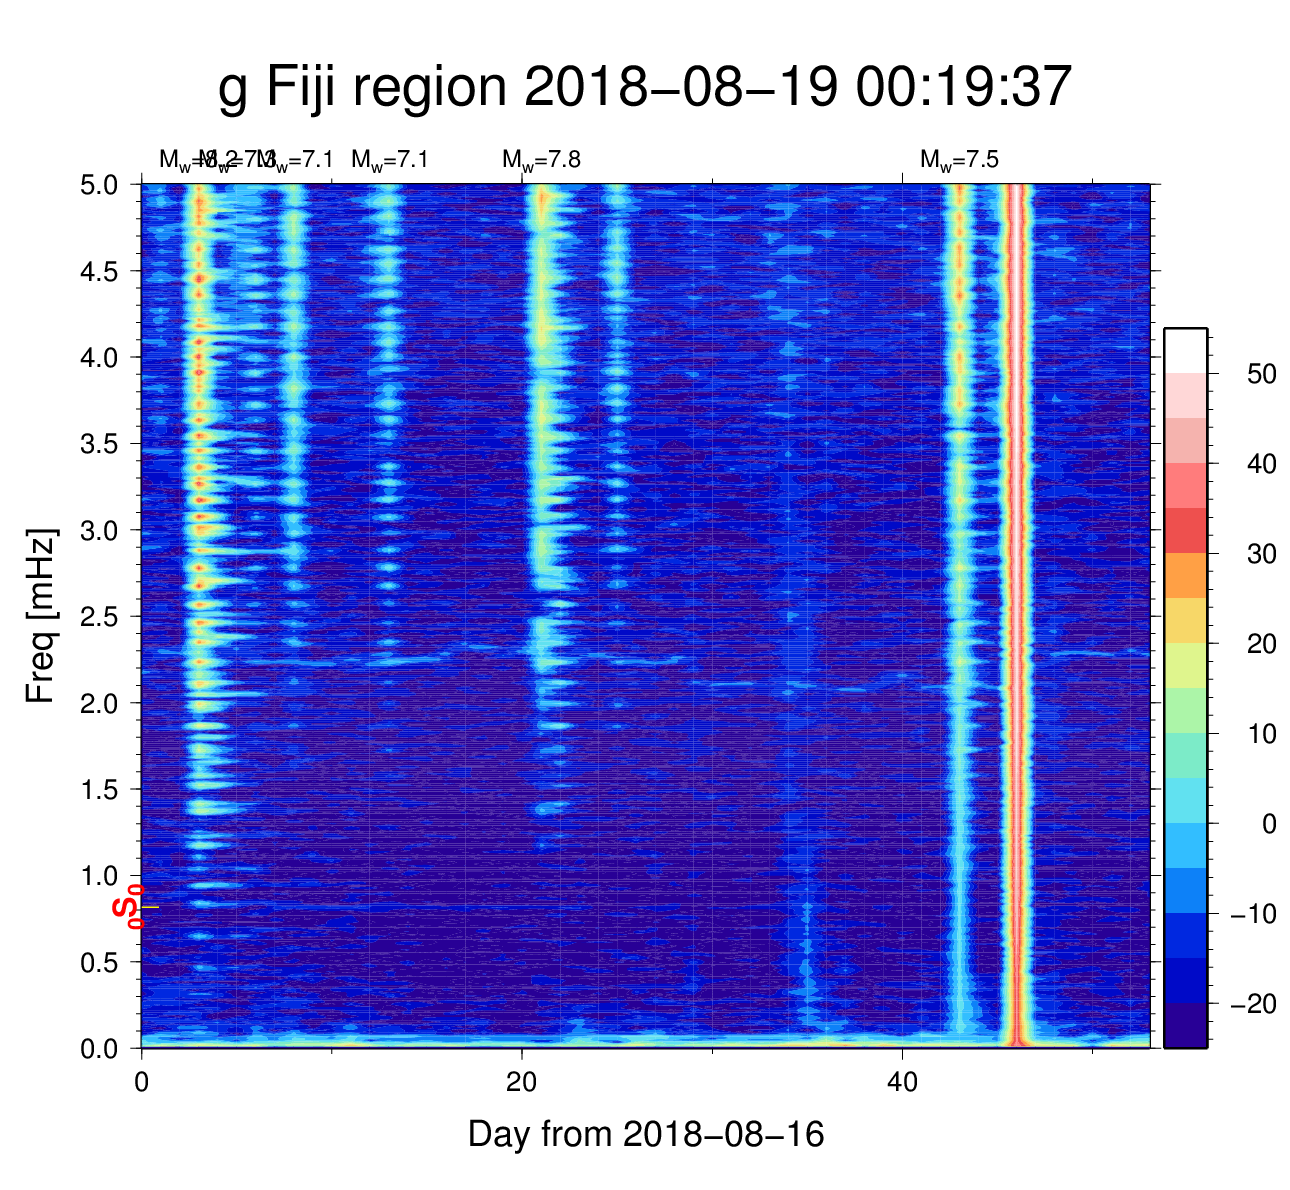
Our shortlist Free oscillation-band plot, the last 30 days Free oscillation-band due to Fiji earthquake Aug. 18, 2018 |
To actualise the big plot, enter 99 for dt, press Send again, and Update the browser cache.
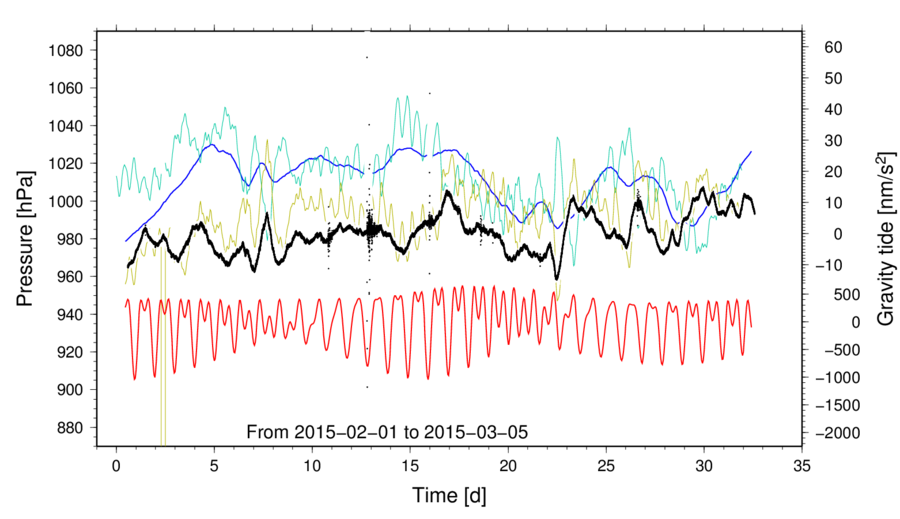
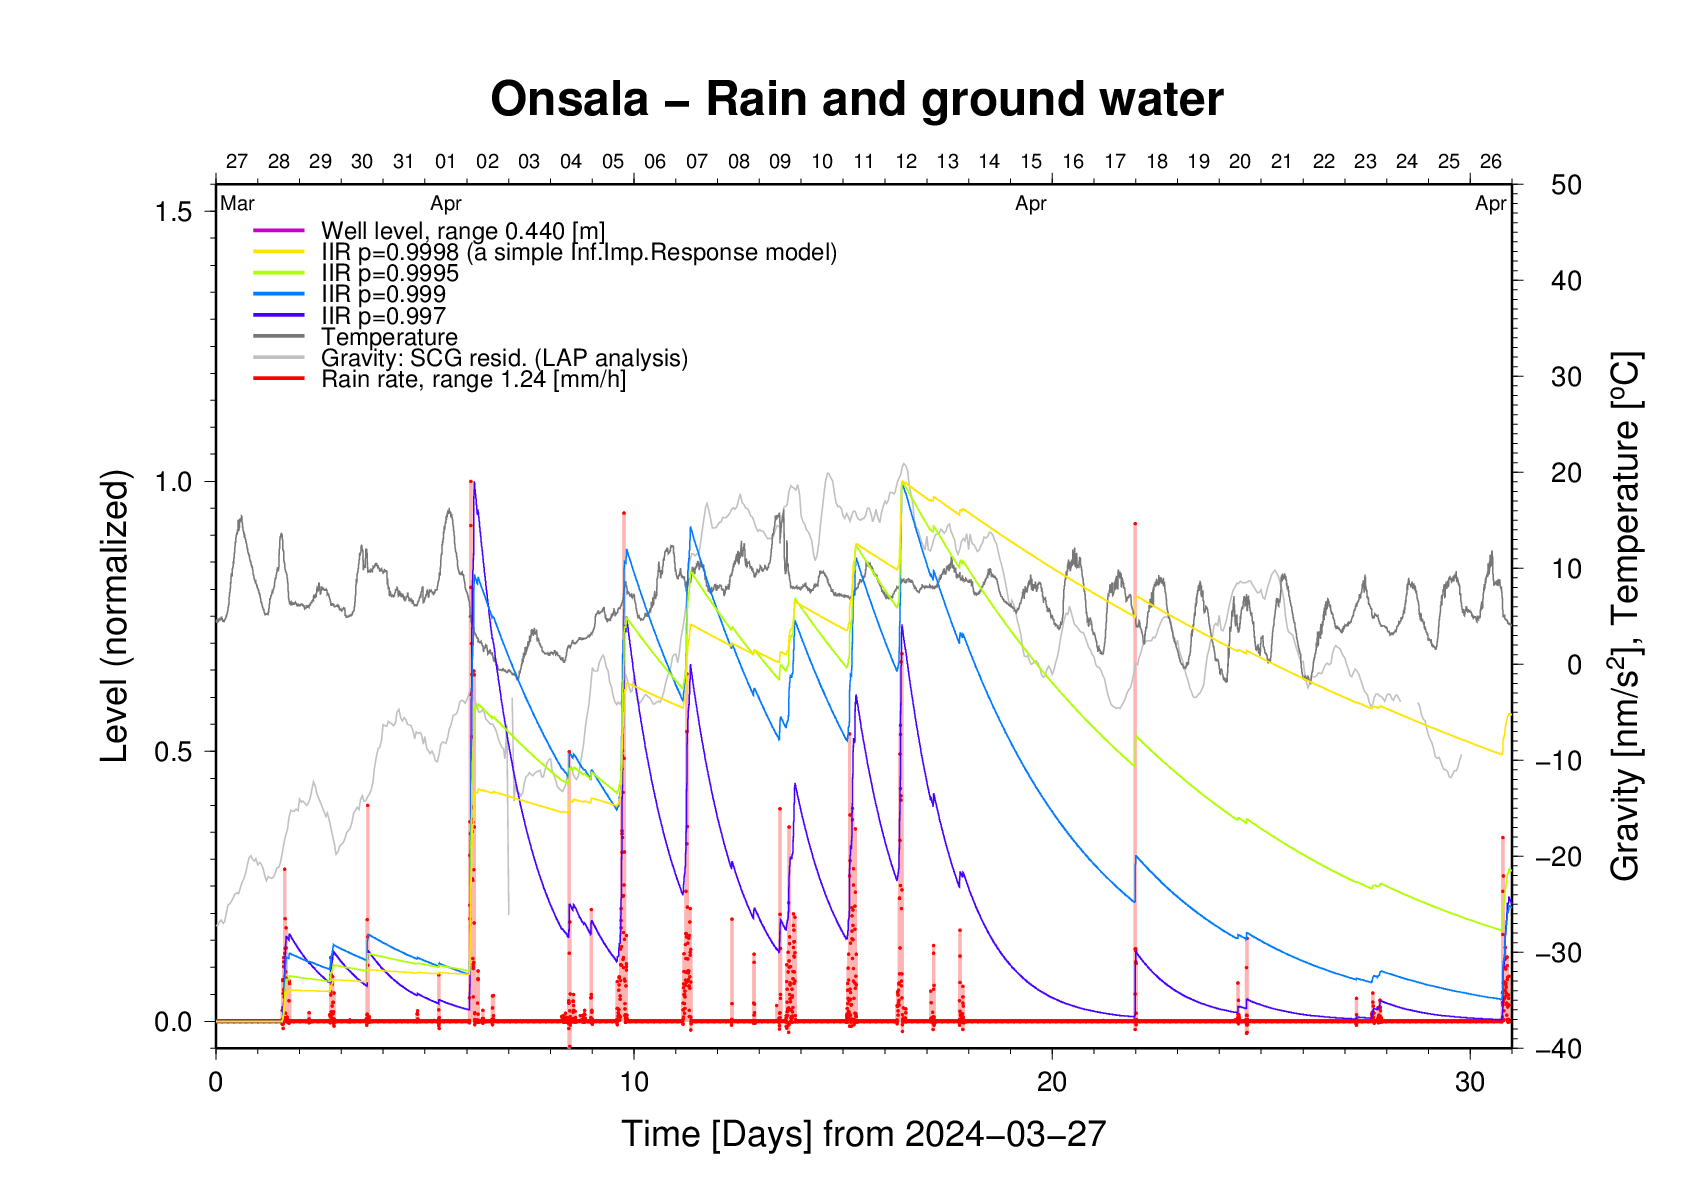
The latest 31 days ( =>in big). ▉: predicted tide; ▉: barometer (P); ▉: inverse water level (IWL) at Onsala in hPa +1013, ▉: bottom pressure proxy at Onsala; (the four at 1 smp/h). ▉: well water level in dm, ▉: tide+baro residual (at 1 smp/min; tide model revisions: 2014-05-01, 2014-05-18, 2015-02-05) P and IWL would follow each other if the response were static. |
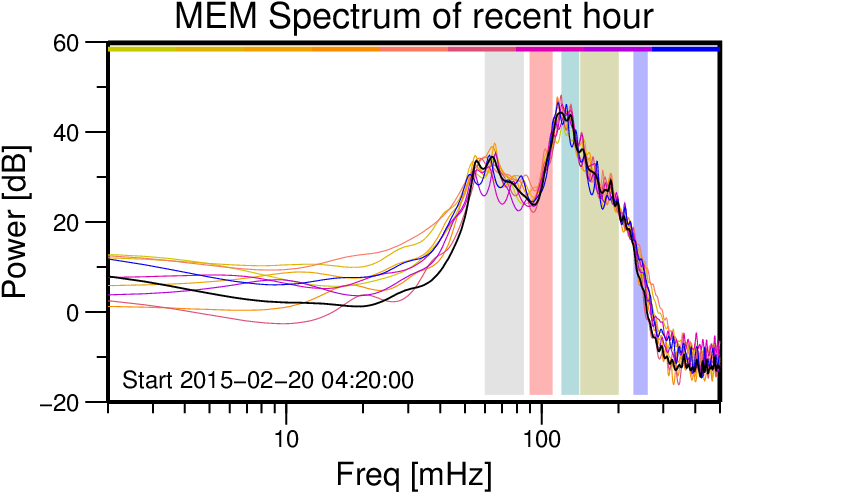
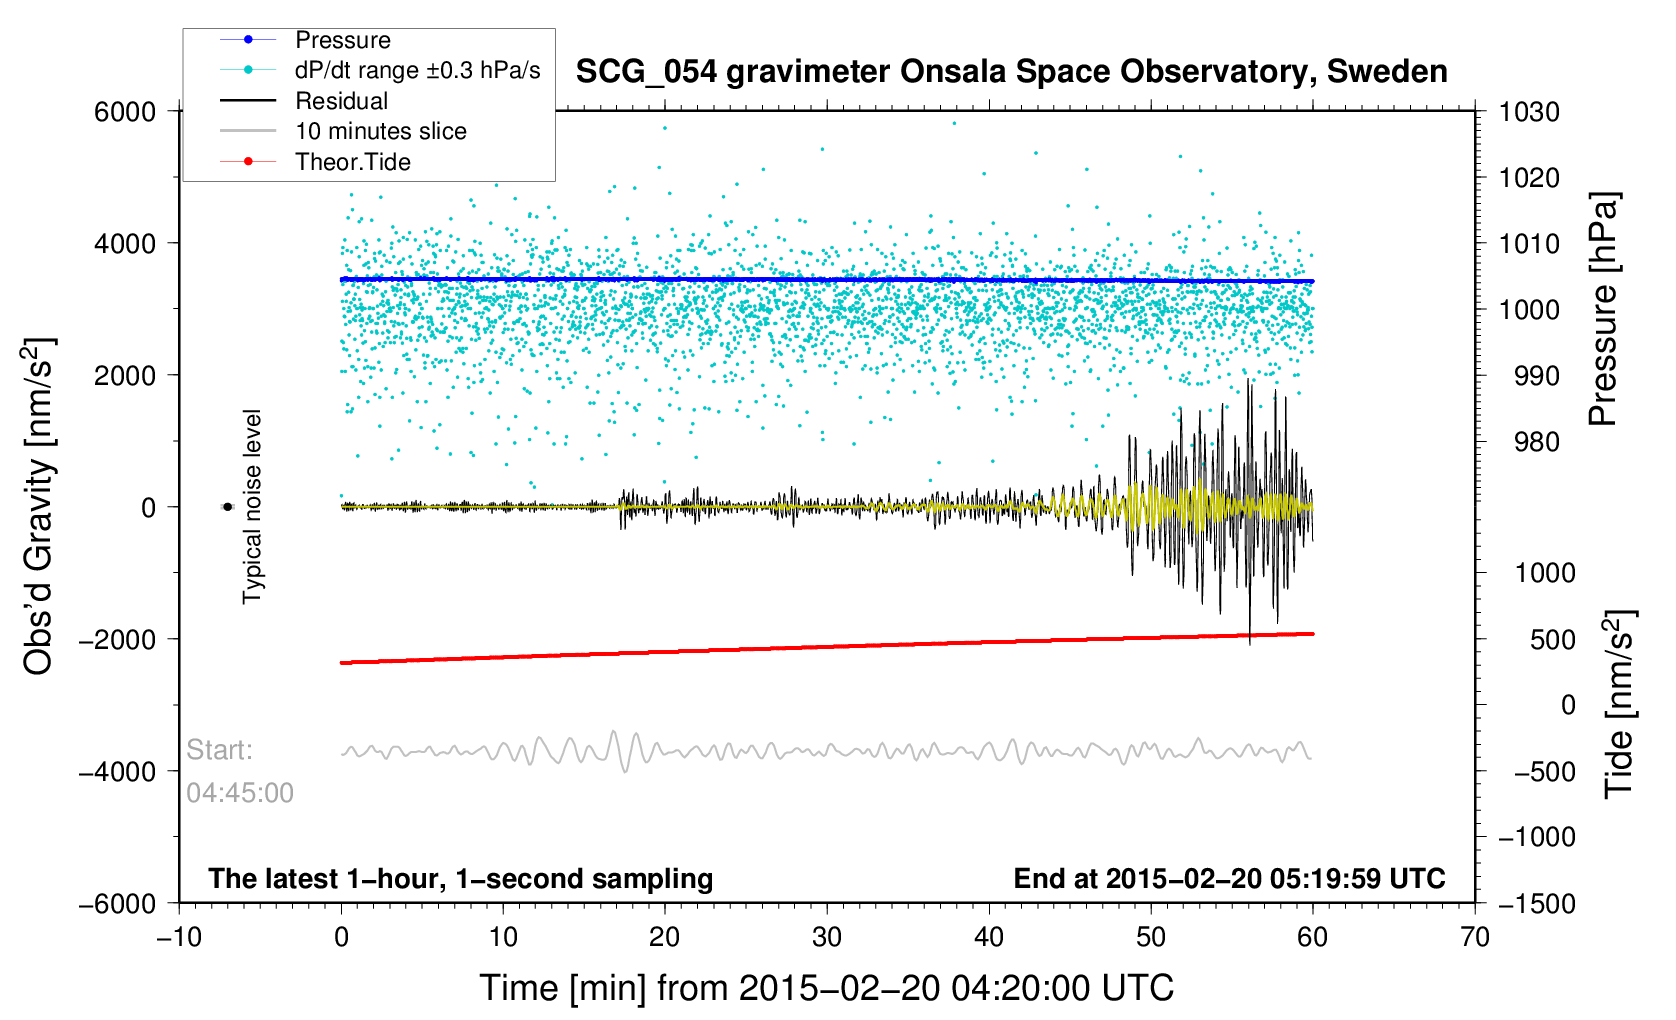
Power spectrum (MEM) of micro-seismicity shows average during one hour (black) and nine sliding 20-minute slices with ten minutes' report (from yellow, early, via red to purple, late). The pyjamas pattern aims to relate frequency to source area: ▉Greater North Atlantic, ▉Biscay, ▉Celtic Shelf, ▉Norwegian Sea, ▉North Sea. More on stormy weather and gravity. Visit spectrograms vs. time; the light-green curve is their baseline. (MEM = maximum entropy method) |